Search Market Research Report

Discover Our Latest Reports
Discover Our Featured Reports
Discover Top Selling Reports

4, 4 Biphenol Market Size, Share Global Analysis Report, 2020–2026

report img

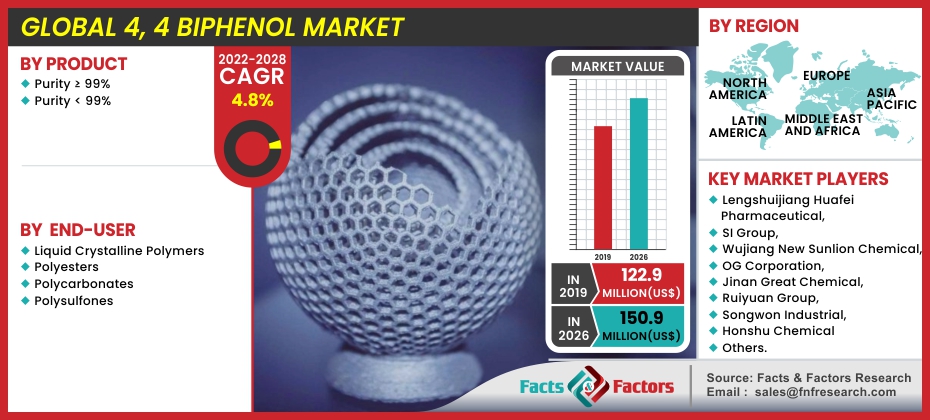
4, 4 Biphenol Market By Product (Purity = 99%, Purity < 99%), By End-User (Liquid Crystalline Polymers, Polyesters, Polycarbonates, Polysulfones): Global Industry Outlook, Market Size, Business Intelligence, Consumer Preferences, Statistical Surveys, Comprehensive Analysis, Historical Developments, Current Trends, and Forecast 2020–2026

Industry Insights

logo
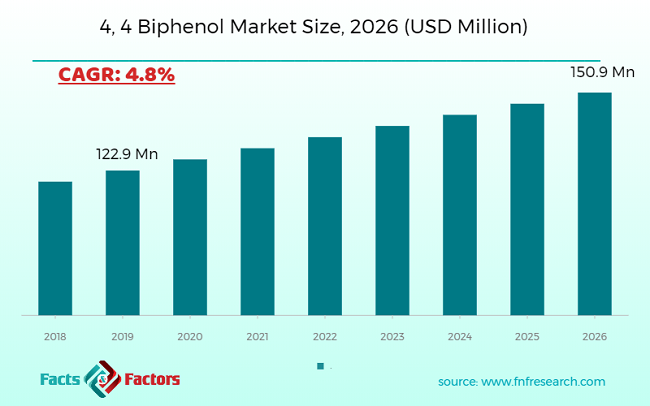
[175+ Pages Report] Global 4,4 biphenol market expected to grow from USD 122.9 million in 2019 to reach USD 150.9 million by 2026, at a CAGR of 4.8% during the forecast period. 

This specialized and expertise oriented industry research report scrutinizes the technical and commercial business outlook of the 4, 4 biphenol industry. The report analyzes and declares the historical and current trends analysis of the 4, 4 bisphenol industry and subsequently recommends the projected trends anticipated to be observed in the 4, 4 biphenol market during the upcoming years.

4, 4 Biphenol Market Size

To know more about this report | Request Free Sample Copy


logoKey Insights from Primary Research        

  • As per our primary respondents, the global 4, 4 biphenol market is set to grow annually at a rate of around 4.8%, and the revenue was valued at around USD 122.9 million in 2019.
  • North America held the largest market share in 2019 due to the growth of the thermoplastics sector in the North America region.
  • On basis of the “Component” segment, the software segment dominated the global 3D scanner market due to the rise in the adoption of new software upgrades for 3D scanners.
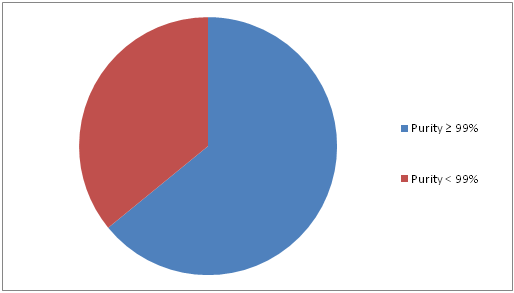
  • On basis of the “Product” segment, the purity ≥ 99% segment dominated the global 4, 4 biphenol market due to the rise in the demand for 4, 4-biphenol from applications such as polycarbonates, liquid crystalline polymers.
  • On basis of the “Application” segment, the liquid crystalline polymers segment dominated the global 4, 4 biphenol market.
  • The presence of well-established players has intensified the industry rivalry, due to which the degree of competition is considerably higher.

logoKey Recommendations from Analysts

  • As per our analysts, the global 4, 4 biphenol market is expected to grow significantly over the forecast period due to the rise in adoption of 4,4 biphenol as a dyestuff intermediate and as a stabilizer.
  • As per analysts, the high growth in the industrial sector is boosting the market.
  • The collaborations and partnerships between the manufacturing firms can create lucrative opportunities worldwide.
  • Our team of analysts has identified, that North America is expected to be the fastest-growing market over the estimated period, the rapid rise in the thermoplastics industry in the region.

logoGlobal 4, 4 Biphenol Market Revenue Share – By Product

4, 4 Biphenol Market

To know more about this report | Request Free Sample Copy


The 4, 4 biphenol market reports analyze and notify the industry statistics at the global as well as regional and country levels in order to acquire a thorough perspective of the entire 4, 4 biphenol market. The historical and past insights are provided for FY 2016 to FY 2019 whereas projected trends are delivered for FY 2020 to FY 2026. The quantitative and numerical data is represented in terms of value (USD Million) from FY 2016 – 2026.

The quantitative data is further underlined and reinforced by comprehensive qualitative data which comprises various across-the-board market dynamics. The rationales which directly or indirectly impact the 4, 4 biphenol industry are exemplified through parameters such as growth drivers, restraints, challenges, and opportunities among other impacting factors.

Throughout our research report, we have encompassed all the proven models and tools of industry analysis and extensively illustrated all the key business strategies and business models adopted in the 4, 4 biphenol industry. The report provides an all-inclusive and detailed competitive landscape prevalent in the 4, 4 biphenol market.

The report utilizes established industry analysis tools and models such as Porter’s Five Forces framework to analyze and recognize critical business strategies adopted by various stakeholders involved in the entire value chain of the 4, 4 biphenol industry. The 4, 4 biphenol market report additionally employs SWOT analysis and PESTLE analysis models for further in-depth analysis.

The report study further includes an in-depth analysis of industry players' market shares and provides an overview of leading players' market position in the 4, 4 biphenol sector. Key strategic developments in 4, 4 biphenol market competitive landscape such as acquisitions & mergers, inaugurations of different products and services, partnerships & joint ventures, MoU agreements, VC & funding activities, R&D activities, and geographic expansion among other noteworthy activities by key players of the 4, 4 biphenol market are appropriately highlighted in the report.

Global 4, 4 Biphenol Market

To know more about this report | Request Free Sample Copy

The global 4, 4 biphenol markets are experiencing significant growth that is expected to continue over the upcoming years. Also, the rise in adoption of 4,4 biphenol as a dyestuff intermediate and as a stabilizer or raw material for the manufacturing of resins like polyesters, polyurethanes, polyepoxides, polycarbonates is expected to propel the market for 4,4 biphenol in the forecast period.

The 4, 4 biphenol market research report delivers an acute valuation and taxonomy of the 4, 4 biphenol industry by practically splitting the market on the basis of different products, end-user, and regions. Through the analysis of the historical and projected trends, all the segments and sub-segments were evaluated through the bottom-up approach, and different market sizes have been projected for FY 2020 to FY 2026. The regional segmentation of the 4, 4 biphenol industry includes the complete classification of all the major continents including North America, Latin America, Europe, Asia Pacific, and the Middle East & Africa. Further, country-wise data for the 4, 4 biphenol industry is provided for the leading economies of the world.

The 4, 4 bisphenol market is segmented based on product, end-user, and region. Based on product, the market is classified into Purity ≥ 99%, and Purity < 99%. On the basis of end-user, the market is classified into liquid crystalline polymers, polyesters, polycarbonates, and polysulfones.

logoReport Scope

Report Attribute

Details

Market Size in 2019

USD 122.9 million

Projected Market Size in 2026

USD 150.9 million

CAGR Growth Rate

4.8% CAGR

Base Year

2019

Forecast Years

2019-2026

Key Market Players

Lengshuijiang Huafei Pharmaceutical, SI Group, Wujiang New Sunlion Chemical, OG Corporation, Jinan Great Chemical, Ruiyuan Group, Songwon Industrial, Honshu Chemical

Key Segment

By Product Type, By End-User, By Region

Major Regions Covered

North America, Europe, Asia Pacific, Latin America, and the Middle East & Africa

Purchase Options

Request customized purchase options to meet your research needs. Explore purchase options

logoCompetitive Landscape

Major key players operating in the 4, 4 biphenol market includes

  • Lengshuijiang Huafei Pharmaceutical
  • SI Group
  • Wujiang New Sunlion Chemical
  • OG Corporation
  • Jinan Great Chemical
  • Ruiyuan Group
  • Songwon Industrial
  • Honshu Chemical

logoThe taxonomy of the 4, 4 biphenol market by its scope and segmentation is as follows:

logo Product Analysis

  • Purity ≥ 99%
  • Purity < 99%

logo End-User Analysis

  • Liquid Crystalline Polymers
  • Polyesters
  • Polycarbonates
  • Polysulfones

logo Regional Segmentation Analysis

  • North America
    • The U.S.
    • Canada
  • Europe
    • Germany
    • The UK
    • France
    • Spain
    • Italy
    • Rest of Europe
  • Asia Pacific
    • China
    • Japan
    • India
    • South Korea
    • Southeast Asia
    • Rest of Asia Pacific
  • Latin America
    • Brazil
    • Mexico
    • Rest of Latin America
  • Middle East & Africa
    • GCC
    • South Africa
    • Rest of Middle East & Africa

Table of Content

  1. Chapter 1 Executive Summary
    1. 1.1. Introduction of 4, 4 Biphenol
    2. 1.2. Global 4, 4 Biphenol Market, 2019 & 2026 (USD Million)
    3. 1.3. Global 4, 4 Biphenol Market, 2016 – 2026 (USD Million)
    4. 1.4. Global 4, 4 Biphenol Market Absolute Revenue Opportunity, 2016 – 2026 (USD Million)
    5. 1.5. Global 4, 4 Biphenol Market Incremental Revenue Opportunity, 2020 – 2026 (USD Million)
  2. Chapter 2 4, 4 Biphenol Market – By Product Analysis
    1. 2.1. Global 4, 4 Biphenol Market – By Product Overview
    2. 2.2. Global 4, 4 Biphenol Market Share, By Product, 2019 & 2026 (USD Million)
    3. 2.3. Purity ≥ 99%
      1. 2.3.1. Global Purity ≥ 99% 4, 4 Biphenol Market, 2016 – 2026 (USD Million)
    4. 2.4. Purity < 99%
      1. 2.4.1. Global Purity < 99% 4, 4 Biphenol Market, 2016 – 2026 (USD Million)
  3. Chapter 3 4, 4 Biphenol Market – By End-User Analysis
    1. 3.1. Global 4, 4 Biphenol Market – By End-User Overview
    2. 3.2. Global 4, 4 Biphenol Market Share, By End-User, 2019 & 2026 (USD Million)
    3. 3.3. Liquid Crystalline Polymers
      1. 3.3.1. Global Liquid Crystalline Polymers 4, 4 Biphenol Market, 2016 – 2026 (USD Million)
    4. 3.4. Polyesters
      1. 3.4.1. Global Polyesters 4, 4 Biphenol Market, 2016 – 2026 (USD Million)
    5. 3.5. Polycarbonates
      1. 3.5.1. Global Polycarbonates 4, 4 Biphenol Market, 2016 – 2026 (USD Million)
    6. 3.6. Polysulfones
      1. 3.6.1. Global Polysulfones 4, 4 Biphenol Market, 2016 – 2026 (USD Million)
  4. Chapter 4 4, 4 Biphenol Market – Regional Analysis
    1. 4.1. Global 4, 4 Biphenol Market Regional Overview
    2. 4.2. Global 4, 4 Biphenol Market Share, by Region, 2019 & 2026 (USD Million)
    3. 4.3. North America
      1. 4.3.1. North America 4, 4 Biphenol Market, 2016 – 2026 (USD Million)
        1. 4.3.1.1. North America 4, 4 Biphenol Market, by Country, 2016 - 2026 (USD Million)
      2. 4.3.2. North America 4, 4 Biphenol Market, By Product, 2016 – 2026
        1. 4.3.2.1. North America 4, 4 Biphenol Market, By Product, 2016 – 2026 (USD Million)
      3. 4.3.3. North America 4, 4 Biphenol Market, By End-User, 2016 – 2026
        1. 4.3.3.1. North America 4, 4 Biphenol Market, By End-User, 2016 – 2026 (USD Million)
      4. 4.3.4. U.S.
        1. 4.3.4.1. U.S. 4, 4 Biphenol Market, 2016 – 2026 (USD Million)
      5. 4.3.5. Canada
        1. 4.3.5.1. Canada 4, 4 Biphenol Market, 2016 – 2026 (USD Million)
    4. 4.4. Europe
      1. 4.4.1. Europe 4, 4 Biphenol Market, 2016 – 2026 (USD Million)
        1. 4.4.1.1. Europe 4, 4 Biphenol Market, by Country, 2016 - 2026 (USD Million)
      2. 4.4.2. Europe 4, 4 Biphenol Market, By Product, 2016 – 2026
        1. 4.4.2.1. Europe 4, 4 Biphenol Market, By Product, 2016 – 2026 (USD Million)
      3. 4.4.3. Europe 4, 4 Biphenol Market, By End-User, 2016 – 2026
        1. 4.4.3.1. Europe 4, 4 Biphenol Market, By End-User, 2016 – 2026 (USD Million)
      4. 4.4.4. Germany
        1. 4.4.4.1. Germany 4, 4 Biphenol Market, 2016 – 2026 (USD Million)
      5. 4.4.5. France
        1. 4.4.5.1. France 4, 4 Biphenol Market, 2016 – 2026 (USD Million)
      6. 4.4.6. U.K.
        1. 4.4.6.1. U.K. 4, 4 Biphenol Market, 2016 – 2026 (USD Million)
      7. 4.4.7. Italy
        1. 4.4.7.1. Italy 4, 4 Biphenol Market, 2016 – 2026 (USD Million)
      8. 4.4.8. Rest of Europe
        1. 4.4.8.1. Rest of Europe 4, 4 Biphenol Market, 2016 – 2026 (USD Million)
    5. 4.5. Asia Pacific
      1. 4.5.1. Asia Pacific 4, 4 Biphenol Market, 2016 – 2026 (USD Million)
        1. 4.5.1.1. Asia Pacific 4, 4 Biphenol Market, by Country, 2016 - 2026 (USD Million)
      2. 4.5.2. Asia Pacific 4, 4 Biphenol Market, By Product, 2016 – 2026
        1. 4.5.2.1. Asia Pacific 4, 4 Biphenol Market, By Product, 2016 – 2026 (USD Million)
      3. 4.5.3. Asia Pacific 4, 4 Biphenol Market, By End-User, 2016 – 2026
        1. 4.5.3.1. Asia Pacific 4, 4 Biphenol Market, By End-User, 2016 – 2026 (USD Million)
      4. 4.5.4. China
        1. 4.5.4.1. China 4, 4 Biphenol Market, 2016 – 2026 (USD Million)
      5. 4.5.5. Japan
        1. 4.5.5.1. Japan 4, 4 Biphenol Market, 2016 – 2026 (USD Million)
      6. 4.5.6. India
        1. 4.5.6.1. India 4, 4 Biphenol Market, 2016 – 2026 (USD Million)
      7. 4.5.7. South Korea
        1. 4.5.7.1. South Korea 4, 4 Biphenol Market, 2016 – 2026 (USD Million)
      8. 4.5.8. Rest of Asia Pacific
        1. 4.5.8.1. Rest of Asia Pacific 4, 4 Biphenol Market, 2016 – 2026 (USD Million)
    6. 4.6. Latin America
      1. 4.6.1. Latin America 4, 4 Biphenol Market, 2016 – 2026 (USD Million)
        1. 4.6.1.1. Latin America 4, 4 Biphenol Market, by Country, 2016 - 2026 (USD Million)
      2. 4.6.2. Latin America 4, 4 Biphenol Market, By Product, 2016 – 2026
        1. 4.6.2.1. Latin America 4, 4 Biphenol Market, By Product, 2016 – 2026 (USD Million)
      3. 4.6.3. Latin America 4, 4 Biphenol Market, By End-User, 2016 – 2026
        1. 4.6.3.1. Latin America 4, 4 Biphenol Market, By End-User, 2016 – 2026 (USD Million)
      4. 4.6.4. Brazil
        1. 4.6.4.1. Brazil 4, 4 Biphenol Market, 2016 – 2026 (USD Million)
      5. 4.6.5. Mexico
        1. 4.6.5.1. Mexico 4, 4 Biphenol Market, 2016 – 2026 (USD Million)
      6. 4.6.6. Rest of Latin America
        1. 4.6.6.1. Rest of Latin America 4, 4 Biphenol Market, 2016 – 2026 (USD Million)
    7. 4.7. The Middle-East and Africa
      1. 4.7.1. The Middle-East and Africa 4, 4 Biphenol Market, 2016 – 2026 (USD Million)
        1. 4.7.1.1. The Middle-East and Africa 4, 4 Biphenol Market, by Country, 2016 - 2026 (USD Million)
      2. 4.7.2. The Middle-East and Africa 4, 4 Biphenol Market, By Product, 2016 – 2026
        1. 4.7.2.1. The Middle-East and Africa 4, 4 Biphenol Market, By Product, 2016 – 2026 (USD Million)
      3. 4.7.3. The Middle-East and Africa 4, 4 Biphenol Market, By End-User, 2016 – 2026
        1. 4.7.3.1. The Middle-East and Africa 4, 4 Biphenol Market, By End-User, 2016 – 2026 (USD Million)
      4. 4.7.4. GCC Countries
        1. 4.7.4.1. GCC Countries 4, 4 Biphenol Market, 2016 – 2026 (USD Million)
      5. 4.7.5. South Africa
        1. 4.7.5.1. South Africa 4, 4 Biphenol Market, 2016 – 2026 (USD Million)
      6. 4.7.6. Rest of Middle-East Africa
        1. 4.7.6.1. Rest of Middle-East Africa 4, 4 Biphenol Market, 2016 – 2026 (USD Million)
  5. Chapter 5 4, 4 Biphenol Market – Competitive Landscape
    1. 5.1. Competitor Market Share – Revenue
    2. 5.2. Market Concentration Rate Analysis, Top 3 and Top 5 Players
    3. 5.3. Strategic Developments
      1. 5.3.1. Acquisitions and Mergers
      2. 5.3.2. New Products
      3. 5.3.3. Research & Development Activities
  6. Chapter 6 Company Profiles
    1. 6.1. SI Group
      1. 6.1.1. Company Overview
      2. 6.1.2. Product/Service Portfolio
      3. 6.1.3. SI Group Sales, Revenue, and Gross Margin
      4. 6.1.4. SI Group Revenue and Growth Rate
      5. 6.1.5. SI Group Market Share
      6. 6.1.6. Recent Initiatives, Funding/VC Activities, and Technological Innovations
    2. 6.2. Honshu Chemical
      1. 6.2.1. Company Overview
      2. 6.2.2. Product/Service Portfolio
      3. 6.2.3. Honshu Chemical Sales, Revenue, and Gross Margin
      4. 6.2.4. Honshu Chemical Revenue and Growth Rate
      5. 6.2.5. Honshu Chemical Market Share
      6. 6.2.6. Recent Initiatives, Funding/VC Activities, and Technological Innovations
    3. 6.3. Lengshuijiang Huafei Pharmaceutical
      1. 6.3.1. Company Overview
      2. 6.3.2. Product/Service Portfolio
      3. 6.3.3. Lengshuijiang Huafei Pharmaceutical Sales, Revenue, and Gross Margin
      4. 6.3.4. Lengshuijiang Huafei Pharmaceutical Revenue and Growth Rate
      5. 6.3.5. Lengshuijiang Huafei Pharmaceutical Market Share
      6. 6.3.6. Recent Initiatives, Funding/VC Activities, and Technological Innovations
    4. 6.4. Jinan Great Chemical
      1. 6.4.1. Company Overview
      2. 6.4.2. Product/Service Portfolio
      3. 6.4.3. Jinan Great Chemical Sales, Revenue, and Gross Margin
      4. 6.4.4. Jinan Great Chemical Revenue and Growth Rate
      5. 6.4.5. Jinan Great Chemical Market Share
      6. 6.4.6. Recent Initiatives, Funding/VC Activities, and Technological Innovations
    5. 6.5. Songwon Industrial
      1. 6.5.1. Company Overview
      2. 6.5.2. Product/Service Portfolio
      3. 6.5.3. Songwon Industrial Sales, Revenue, and Gross Margin
      4. 6.5.4. Songwon Industrial Revenue and Growth Rate
      5. 6.5.5. Songwon Industrial Market Share
      6. 6.5.6. Recent Initiatives, Funding/VC Activities, and Technological Innovations
    6. 6.6. Wujiang New Sunlion Chemical
      1. 6.6.1. Company Overview
      2. 6.6.2. Product/Service Portfolio
      3. 6.6.3. Wujiang New Sunlion Chemical Sales, Revenue, and Gross Margin
      4. 6.6.4. Wujiang New Sunlion Chemical Revenue and Growth Rate
      5. 6.6.5. Wujiang New Sunlion Chemical Market Share
      6. 6.6.6. Recent Initiatives, Funding/VC Activities, and Technological Innovations
    7. 6.7. Ruiyuan Group
      1. 6.7.1. Company Overview
      2. 6.7.2. Product/Service Portfolio
      3. 6.7.3. Ruiyuan Group Sales, Revenue, and Gross Margin
      4. 6.7.4. Ruiyuan Group Revenue and Growth Rate
      5. 6.7.5. Ruiyuan Group Market Share
      6. 6.7.6. Recent Initiatives, Funding/VC Activities, and Technological Innovations
  7. Chapter 7 4, 4 Biphenol — Industry Analysis
    1. 7.1. Introduction and Taxonomy
    2. 7.2. 4, 4 Biphenol Market – Key Trends
      1. 7.2.1. Market Drivers
      2. 7.2.2. Market Restraints
      3. 7.2.3. Market Opportunities
    3. 7.3. Value Chain Analysis
    4. 7.4. Key Mandates and Regulations
    5. 7.5. Technology Roadmap and Timeline
    6. 7.6. 4, 4 Biphenol Market – Attractiveness Analysis
      1. 7.6.1. By Product
      2. 7.6.2. By End-User
      3. 7.6.3. By Region
  8. Chapter 8 Industrial Chain, Sourcing Strategy, and Downstream Buyers
    1. 8.1. 4, 4 Biphenol Industrial Chain Analysis
    2. 8.2. Downstream Buyers
    3. 8.3. Distributors/Traders List
  9. Chapter 9 Marketing Strategy Analysis
    1. 9.1. Marketing Channel
    2. 9.2. Direct Marketing
    3. 9.3. Indirect Marketing
    4. 9.4. Marketing Channel Development Trends
    5. 9.5. Economic/Political Environmental Change
  10. Chapter 10 Report Conclusion & Key Insights
    1. 10.1. Key Insights from Primary Interviews & Surveys Respondents
    2. 10.2. Key Takeaways from Analysts, Consultants, and Industry Leaders
  11. Chapter 11 Research Approach & Methodology
    1. 11.1. Report Description
    2. 11.2. Research Scope
    3. 11.3. Research Methodology
      1. 11.3.1. Secondary Research
      2. 11.3.2. Primary Research
      3. 11.3.3. Statistical Models
        1. 11.3.3.1. Company Share Analysis Model
        2. 11.3.3.2. Revenue Based Modeling
      4. 11.3.4. Research Limitations

      List of Figures

      Fig.1 Product Picture of 4, 4 Biphenol
      Fig.2 Global 4, 4 Biphenol Market, 2016 – 2026 (USD Million)
      Fig.3 Global 4, 4 Biphenol Market Absolute Revenue Opportunity, 2016 – 2026 (USD Million)
      Fig.4 Global 4, 4 Biphenol Market Incremental Revenue Opportunity, 2020 – 2026 (USD Million)
      Fig.5 Global 4, 4 Biphenol Market Share, By Product, 2019 & 2026 (USD Million)
      Fig.6 Global Purity ≥ 99% 4, 4 Biphenol Market, 2016 – 2026 (USD Million)
      Fig.7 Global Purity < 99% 4, 4 Biphenol Market, 2016 – 2026 (USD Million)
      Fig.8 Global 4, 4 Biphenol Market Share, By End-User, 2019 & 2026 (USD Million)
      Fig.9 Global Liquid Crystalline Polymers 4, 4 Biphenol Market, 2016 – 2026 (USD Million)
      Fig.10 Global Polyesters 4, 4 Biphenol Market, 2016 – 2026 (USD Million)
      Fig.11 Global Polycarbonates 4, 4 Biphenol Market, 2016 – 2026 (USD Million)
      Fig.12 Global Polysulfones 4, 4 Biphenol Market, 2016 – 2026 (USD Million)
      Fig.13 Global 4, 4 Biphenol Market Share, by Region, 2019 & 2026 (USD Million)
      Fig.14 North America 4, 4 Biphenol Market, 2016 – 2026 (USD Million)
      Fig.15 U.S. 4, 4 Biphenol Market, 2016 – 2026 (USD Million)
      Fig.16 Canada 4, 4 Biphenol Market, 2016 – 2026 (USD Million)
      Fig.17 Europe 4, 4 Biphenol Market, 2016 – 2026 (USD Million)
      Fig.18 Germany 4, 4 Biphenol Market, 2016 – 2026 (USD Million)
      Fig.19 France 4, 4 Biphenol Market, 2016 – 2026 (USD Million)
      Fig.20 U.K. 4, 4 Biphenol Market, 2016 – 2026 (USD Million)
      Fig.21 Italy 4, 4 Biphenol Market, 2016 – 2026 (USD Million)
      Fig.22 Rest of Europe 4, 4 Biphenol Market, 2016 – 2026 (USD Million)
      Fig.23 Asia Pacific 4, 4 Biphenol Market, 2016 – 2026 (USD Million)
      Fig.24 China 4, 4 Biphenol Market, 2016 – 2026 (USD Million)
      Fig.25 Japan 4, 4 Biphenol Market, 2016 – 2026 (USD Million)
      Fig.26 India 4, 4 Biphenol Market, 2016 – 2026 (USD Million)
      Fig.27 South Korea 4, 4 Biphenol Market, 2016 – 2026 (USD Million)
      Fig.28 Rest of Asia Pacific 4, 4 Biphenol Market, 2016 – 2026 (USD Million)
      Fig.29 Latin America 4, 4 Biphenol Market, 2016 – 2026 (USD Million)
      Fig.30 Brazil 4, 4 Biphenol Market, 2016 – 2026 (USD Million)
      Fig.31 Mexico 4, 4 Biphenol Market, 2016 – 2026 (USD Million)
      Fig.32 Rest of Latin America 4, 4 Biphenol Market, 2016 – 2026 (USD Million)
      Fig.33 The Middle-East and Africa 4, 4 Biphenol Market, 2016 – 2026 (USD Million)
      Fig.34 GCC Countries 4, 4 Biphenol Market, 2016 – 2026 (USD Million)
      Fig.35 South Africa 4, 4 Biphenol Market, 2016 – 2026 (USD Million)
      Fig.36 Rest of Middle-East Africa 4, 4 Biphenol Market, 2016 – 2026 (USD Million)
      Fig.37 Competitor Market Share – Revenue
      Fig.38 SI Group Revenue and Growth Rate
      Fig.39 SI Group Market Share
      Fig.40 Honshu Chemical Revenue and Growth Rate
      Fig.41 Honshu Chemical Market Share
      Fig.42 Lengshuijiang Huafei Pharmaceutical Revenue and Growth Rate
      Fig.43 Lengshuijiang Huafei Pharmaceutical Market Share
      Fig.44 Jinan Great Chemical Revenue and Growth Rate
      Fig.45 Jinan Great Chemical Market Share
      Fig.46 Songwon Industrial Revenue and Growth Rate
      Fig.47 Songwon Industrial Market Share
      Fig.48 Wujiang New Sunlion Chemical Revenue and Growth Rate
      Fig.49 Wujiang New Sunlion Chemical Market Share
      Fig.50 Ruiyuan Group Revenue and Growth Rate
      Fig.51 Ruiyuan Group Market Share
      Fig.52 Market Dynamics
      Fig.53 Global 4, 4 Biphenol – Value Chain Analysis
      Fig.54 Key Mandates and Regulations
      Fig.55 Technology Roadmap and Timeline
      Fig.56 Market Attractiveness Analysis – By Product
      Fig.57 Market Attractiveness Analysis – By End-User
      Fig.58 Market Attractiveness Analysis – By Region
      Fig.59 4, 4 Biphenol Industrial Chain Analysis
      Fig.60 Market Channels
      Fig.61 Marketing Channel Development Trend
      Fig.62 Growth in World Gross Product, 2008-2018
      

      List of Tables

      Table 1 Global 4, 4 Biphenol Market, 2019 & 2026 (USD Million)
      Table 2 Global 4, 4 Biphenol Market, By Product, 2016 – 2026 (USD Million)
      Table 3 Global 4, 4 Biphenol Market, By End-User, 2016 – 2026 (USD Million)
      Table 4 Global 4, 4 Biphenol Market, by Region, 2016 – 2026 (USD Million)
      Table 5 North America 4, 4 Biphenol Market, by Country, 2016 – 2026 (USD Million)
      Table 6 North America 4, 4 Biphenol Market, By Product, 2016 – 2026 (USD Million)
      Table 7 North America 4, 4 Biphenol Market, By End-User, 2016 – 2026 (USD Million)
      Table 8 Europe 4, 4 Biphenol Market, by Country, 2016 – 2026 (USD Million)
      Table 9 Europe 4, 4 Biphenol Market, By Product, 2016 – 2026 (USD Million)
      Table 10 Europe 4, 4 Biphenol Market, By End-User, 2016 – 2026 (USD Million)
      Table 11 Asia Pacific 4, 4 Biphenol Market, by Country, 2016 – 2026 (USD Million)
      Table 12 Asia Pacific 4, 4 Biphenol Market, By Product, 2016 – 2026 (USD Million)
      Table 13 Asia Pacific 4, 4 Biphenol Market, By End-User, 2016 – 2026 (USD Million)
      Table 14 Latin America 4, 4 Biphenol Market, by Country, 2016 – 2026 (USD Million)
      Table 15 Latin America 4, 4 Biphenol Market, By Product, 2016 – 2026 (USD Million)
      Table 16 Latin America 4, 4 Biphenol Market, By End-User, 2016 – 2026 (USD Million)
      Table 17 The Middle-East and Africa 4, 4 Biphenol Market, by Country, 2016 – 2026 (USD Million)
      Table 18 The Middle-East and Africa 4, 4 Biphenol Market, By Product, 2016 – 2026 (USD Million)
      Table 19 The Middle-East and Africa 4, 4 Biphenol Market, By End-User, 2016 – 2026 (USD Million)
      Table 20 Global 4, 4 Biphenol Market - Company Revenue Analysis, 2016 – 2019 (USD Million)
      Table 21 Global 4, 4 Biphenol Market - Company Revenue Share Analysis, 2016 – 2019 (%)
      Table 22 Acquisitions and Mergers
      Table 23 Market Drivers – Impact Analysis
      Table 24 Market Restraints
      Table 25 Market Opportunities
      Table 26 Major Buyers of 4, 4 Biphenol
      Table 27 Distributors/Traders of 4, 4 Biphenol by Region
      

Industry Major Market Players

  • Lengshuijiang Huafei Pharmaceutical
  • SI Group
  • Wujiang New Sunlion Chemical
  • OG Corporation
  • Jinan Great Chemical
  • Ruiyuan Group
  • Songwon Industrial
  • Honshu Chemical