Search Market Research Report

Discover Our Latest Reports
Discover Our Featured Reports
Discover Top Selling Reports

3D Scanner Market Size, Share Global Analysis Report, 2020–2026

report img

3D Scanner Market By Component (Hardware, Software, Services), By Type (Portable, Desktop Based, Fixed Mount, Robot Mount), By End-User (Automotive, Healthcare, Aerospace & Defense, Education, Manufacturing, Media & Entertainment, Others): Global Industry Outlook, Market Size, Business Intelligence, Consumer Preferences, Statistical Surveys, Comprehensive Analysis, Historical Developments, Current Trends, and Forecast 2020–2026

Industry Insights

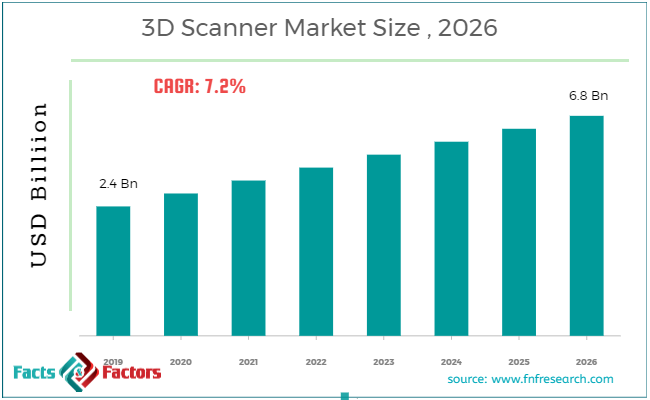
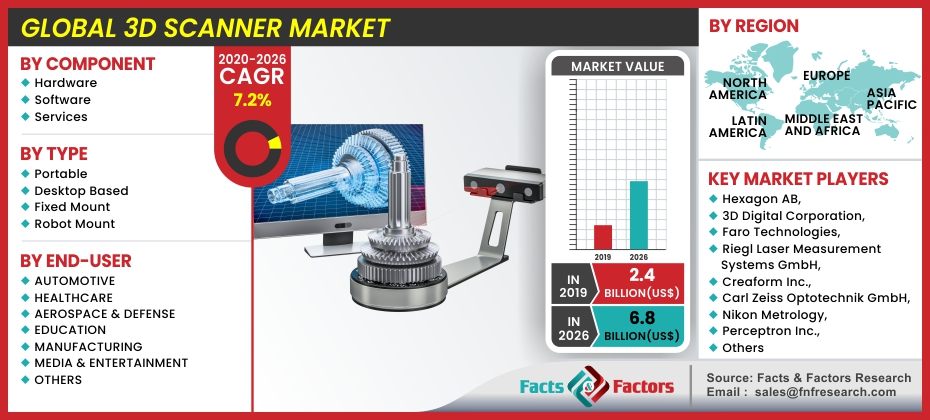
[170+ Pages Report] According to the report published by Facts Factors, the global 3D Scanner market size was worth around USD 2.4 billion in 2019 and is predicted to grow to around USD 6.8 billion by 2026 with a compound annual growth rate (CAGR) of roughly 7.2% between 2020 and 2026. The report analyzes the global 3D Scanner market drivers, restraints/challenges, and the effect they have on the demands during the projection period. In addition, the report explores emerging opportunities in the 3D Scanner market.
    

3d-scanner-market-size

To know more about this report | Request Free Sample Copy

This specialized and expertise-oriented industry research report scrutinizes the technical and commercial business outlook of the 3D scanner industry. The report analyzes and declares the historical and current trends analysis of the 3D scanner industry and subsequently recommends the projected trends anticipated to be observed in the 3D scanner market during the upcoming years.

The 3D scanner market report analyzes and notifies the industry statistics at the global as well as regional and country levels in order to acquire a thorough perspective of the entire 3D scanner market. The historical and past insights are provided for FY 2016 to FY 2019 whereas projected trends are delivered for FY 2020 to FY 2026. The quantitative and numerical data is represented in terms of value (USD Million) from FY 2016 – 2026.

The quantitative data is further underlined and reinforced by comprehensive qualitative data which comprises various across-the-board market dynamics. The rationales which directly or indirectly impact the 3D scanner industry are exemplified through parameters such as growth drivers, restraints, challenges, and opportunities among other impacting factors.

3D Scanner Market

To know more about this report | Request Free Sample Copy

Throughout our research report, we have encompassed all the proven models and tools of industry analysis and extensively illustrated all the key business strategies and business models adopted in the 3D scanner industry. The report provides an all-inclusive and detailed competitive landscape prevalent in the 3D scanner market.

The report utilizes established industry analysis tools and models such as Porter’s Five Forces framework to analyze and recognize critical business strategies adopted by various stakeholders involved in the entire value chain of the 3D scanner industry. The 3D scanner market report additionally employs SWOT analysis and PESTLE analysis models for further in-depth analysis.


logoKey Insights from Primary Research        

  • As per our primary respondents, the global 3D scanner market is set to grow annually at a rate of around 7.2%, and the revenue was valued at around USD 2.4 Billion in 2019.
  • The U.S. held the largest market share in 2019 due to the high adoption of the automotive as well as healthcare sectors in this region.
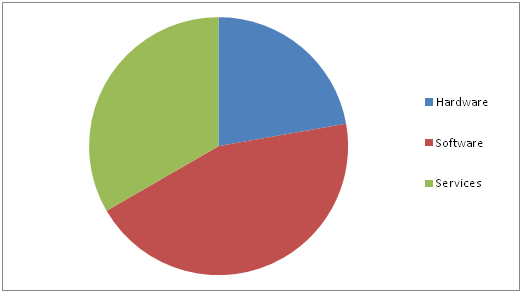
  • On basis of the “Component” segment, the software segment dominated the global 3D scanner market due to the rise in the adoption of new software upgrades for 3D scanners.
  • On basis of the “End-User” segment, the automotive segment dominated the global 3D scanner market because it is widely used in automotive for quality control purposes and also for inspection applications.
  • The presence of well-established players has intensified the industry rivalry, due to which the degree of competition is considerably higher.

logoKey Recommendations from Analysts

  • As per our analysts, the global 3D scanner market is expected to grow significantly over the forecast period due to the rise in manufacturing as well as industrialization.
  • As per analysts, the high growth in the automobile sector is boosting the market.
  • The collaborations and partnerships between manufacturing firms can create lucrative opportunities worldwide.
  • Our team of analysts has identified, that the U.S. is expected to be the fastest-growing market over the estimated period, as the research and development field is increasing and also the modeling operations in the region.

logoGlobal 3D Scanner Market Revenue Share – By Component

3D Scanner Market

To know more about this report | Request Free Sample Copy


The report study further includes an in-depth analysis of industry players' market shares and provides an overview of leading players' market position in the 3D scanner sector. Key strategic developments in 3D scanner market competitive landscape such as acquisitions & mergers, inaugurations of different products and services, partnerships & joint ventures, MoU agreements, VC & funding activities, R&D activities, and geographic expansion among other noteworthy activities by key players of the 3D scanner market are appropriately highlighted in the report.

The global 3D scanner market is experiencing significant growth that is expected to continue over the upcoming years. Also, the rise in manufacturing, as well as industrialization, is the major factor that is boosting the market for 3D scanners. Also, 3D scanners are widely used in the aerospace, automobile as well as construction sectors.

The 3D scanner market research report delivers an acute valuation and taxonomy of the 3D scanner industry by practically splitting the market on the basis of different components, types, end-users, and regions. Through the analysis of the historical and projected trends, all the segments and sub-segments were evaluated through the bottom-up approach, and different market sizes have been projected for FY 2020 to FY 2026.

The regional segmentation of the 3D scanner industry includes the complete classification of all the major continents including North America, Latin America, Europe, Asia Pacific, and the Middle East & Africa. Further, country-wise data for the 3D scanner industry is provided for the leading economies of the world.

logoReport Scope

Report Attribute

Details

Market Size in 2019

USD 2.4 Billion

Projected Market Size in 2026

USD 6.8 Billion

CAGR Growth Rate

7.2% CAGR

Base Year

2019

Forecast Years

2020-2026

Key Market Players

Hexagon AB, 3D Digital Corporation, Faro Technologies, Riegl Laser Measurement Systems GmbH, Creaform Inc., Carl Zeiss Optotechnik GmbH, Nikon Metrology, Perceptron Inc., Trimble Navigation Ltd., Ametek, GOM GmbH, Maptek, Topcon Corporation, and others.

Key Segment

By Component, Type, End-User, and Region

Major Regions Covered

North America, Europe, Asia Pacific, Latin America, and the Middle East &, Africa

Purchase Options

Request customized purchase options to meet your research needs. Explore purchase options

The 3D scanner market is segmented based on component, type, end-user, and region. On the basis of components, the market is classified into hardware, software, and services. On the basis of type segmentation, the market is classified into portable, desktop-based, fixed-mount, and robot-mount. In terms of end-user segmentation, the market is bifurcated into automotive, healthcare, aerospace & defense, education, manufacturing, media & entertainment, and others.

logoMajor key players operating in the 3D scanner market include

  • Hexagon AB
  • 3D Digital Corporation
  • Faro Technologies
  • Riegl Laser Measurement Systems GmbH
  • Creaform Inc.
  • Carl Zeiss Optotechnik GmbH
  • Nikon Metrology
  • Perceptron Inc.
  • Trimble Navigation Ltd.
  • Ametek
  • GOM GmbH
  • Maptek
  • Topcon Corporation

The taxonomy of the 3D scanner market by its scope and segmentation is as follows:

logo Component Segmentation  Analysis

  • Hardware
  • Software
  • Services

logo Type Segmentation  Analysis

  • Portable
  • Desktop Based
  • Fixed Mount
  • Robot Mount

logo End-User Segmentation Analysis

  • Automotive
  • Healthcare
  • Aerospace & Defense
  • Education
  • Manufacturing
  • Media & Entertainment
  • Others

logo Regional Segmentation Analysis

  • North America
    • The U.S.
    • Canada
  • Europe
    • Germany
    • The UK
    • France
    • Spain
    • Italy
    • Rest of Europe
  • Asia Pacific
    • China
    • Japan
    • India
    • South Korea
    • Southeast Asia
    • Rest of Asia Pacific
  • Latin America
    • Brazil
    • Mexico
    • Rest of Latin America
  • Middle East & Africa
    • GCC
    • South Africa
    • Rest of the Middle East & Africa

Table of Content

  1. Chapter 1 Executive Summary
    1. 1.1. Introduction of 3D Scanner
    2. 1.2. Global 3D Scanner Market, 2019 & 2026 (USD Million)
    3. 1.3. Global 3D Scanner Market, 2016 – 2026 (USD Million)
    4. 1.4. Global 3D Scanner Market Absolute Revenue Opportunity, 2016 – 2026 (USD Million)
    5. 1.5. Global 3D Scanner Market Incremental Revenue Opportunity, 2020 – 2026 (USD Million)
  2. Chapter 2 3D Scanner Market – By Component Analysis
    1. 2.1. Global 3D Scanner Market – By Component Overview
    2. 2.2. Global 3D Scanner Market Share, By Component, 2019 & 2026 (USD Million)
    3. 2.3. Hardware
      1. 2.3.1. Global Hardware 3D Scanner Market, 2016 – 2026 (USD Million)
    4. 2.4. Software
      1. 2.4.1. Global Software 3D Scanner Market, 2016 – 2026 (USD Million)
    5. 2.5. Services
      1. 2.5.1. Global Services 3D Scanner Market, 2016 – 2026 (USD Million)
  3. Chapter 3 3D Scanner Market – By Type Analysis
    1. 3.1. Global 3D Scanner Market – By Type Overview
    2. 3.2. Global 3D Scanner Market Share, By Type, 2019 & 2026 (USD Million)
    3. 3.3. Portable
      1. 3.3.1. Global Portable 3D Scanner Market, 2016 – 2026 (USD Million)
    4. 3.4. Desktop Based
      1. 3.4.1. Global Desktop Based 3D Scanner Market, 2016 – 2026 (USD Million)
    5. 3.5. Fixed Mount
      1. 3.5.1. Global Fixed Mount 3D Scanner Market, 2016 – 2026 (USD Million)
    6. 3.6. Robot Mount
      1. 3.6.1. Global Robot Mount 3D Scanner Market, 2016 – 2026 (USD Million)
  4. Chapter 4 3D Scanner Market – By End-User Analysis
    1. 4.1. Global 3D Scanner Market – By End-User Overview
    2. 4.2. Global 3D Scanner Market Share, By End-User, 2019 & 2026 (USD Million)
    3. 4.3. Automotive
      1. 4.3.1. Global Automotive 3D Scanner Market, 2016 – 2026 (USD Million)
    4. 4.4. Healthcare
      1. 4.4.1. Global Healthcare 3D Scanner Market, 2016 – 2026 (USD Million)
    5. 4.5. Aerospace & Defense
      1. 4.5.1. Global Aerospace & Defense 3D Scanner Market, 2016 – 2026 (USD Million)
    6. 4.6. Education
      1. 4.6.1. Global Education 3D Scanner Market, 2016 – 2026 (USD Million)
    7. 4.7. Manufacturing
      1. 4.7.1. Global Manufacturing 3D Scanner Market, 2016 – 2026 (USD Million)
    8. 4.8. Media & Entertainment
      1. 4.8.1. Global Media & Entertainment 3D Scanner Market, 2016 – 2026 (USD Million)
    9. 4.9. Others
      1. 4.9.1. Global Others 3D Scanner Market, 2016 – 2026 (USD Million)
  5. Chapter 5 3D Scanner Market – Regional Analysis
    1. 5.1. Global 3D Scanner Market Regional Overview
    2. 5.2. Global 3D Scanner Market Share, by Region, 2019 & 2026 (USD Million)
    3. 5.3. North America
      1. 5.3.1. North America 3D Scanner Market, 2016 – 2026 (USD Million)
        1. 5.3.1.1. North America 3D Scanner Market, by Country, 2016 - 2026 (USD Million)
      2. 5.3.2. North America 3D Scanner Market, By Component, 2016 – 2026
        1. 5.3.2.1. North America 3D Scanner Market, By Component, 2016 – 2026 (USD Million)
      3. 5.3.3. North America 3D Scanner Market, By Type, 2016 – 2026
        1. 5.3.3.1. North America 3D Scanner Market, By Type, 2016 – 2026 (USD Million)
      4. 5.3.4. North America 3D Scanner Market, By End-User, 2016 – 2026
        1. 5.3.4.1. North America 3D Scanner Market, By End-User, 2016 – 2026 (USD Million)
      5. 5.3.5. U.S.
        1. 5.3.5.1. U.S. 3D Scanner Market, 2016 – 2026 (USD Million)
      6. 5.3.6. Canada
        1. 5.3.6.1. Canada 3D Scanner Market, 2016 – 2026 (USD Million)
    4. 5.4. Europe
      1. 5.4.1. Europe 3D Scanner Market, 2016 – 2026 (USD Million)
        1. 5.4.1.1. Europe 3D Scanner Market, by Country, 2016 - 2026 (USD Million)
      2. 5.4.2. Europe 3D Scanner Market, By Component, 2016 – 2026
        1. 5.4.2.1. Europe 3D Scanner Market, By Component, 2016 – 2026 (USD Million)
      3. 5.4.3. Europe 3D Scanner Market, By Type, 2016 – 2026
        1. 5.4.3.1. Europe 3D Scanner Market, By Type, 2016 – 2026 (USD Million)
      4. 5.4.4. Europe 3D Scanner Market, By End-User, 2016 – 2026
        1. 5.4.4.1. Europe 3D Scanner Market, By End-User, 2016 – 2026 (USD Million)
      5. 5.4.5. Germany
        1. 5.4.5.1. Germany 3D Scanner Market, 2016 – 2026 (USD Million)
      6. 5.4.6. France
        1. 5.4.6.1. France 3D Scanner Market, 2016 – 2026 (USD Million)
      7. 5.4.7. U.K.
        1. 5.4.7.1. U.K. 3D Scanner Market, 2016 – 2026 (USD Million)
      8. 5.4.8. Italy
        1. 5.4.8.1. Italy 3D Scanner Market, 2016 – 2026 (USD Million)
      9. 5.4.9. Rest of Europe
        1. 5.4.9.1. Rest of Europe 3D Scanner Market, 2016 – 2026 (USD Million)
    5. 5.5. Asia Pacific
      1. 5.5.1. Asia Pacific 3D Scanner Market, 2016 – 2026 (USD Million)
        1. 5.5.1.1. Asia Pacific 3D Scanner Market, by Country, 2016 - 2026 (USD Million)
      2. 5.5.2. Asia Pacific 3D Scanner Market, By Component, 2016 – 2026
        1. 5.5.2.1. Asia Pacific 3D Scanner Market, By Component, 2016 – 2026 (USD Million)
      3. 5.5.3. Asia Pacific 3D Scanner Market, By Type, 2016 – 2026
        1. 5.5.3.1. Asia Pacific 3D Scanner Market, By Type, 2016 – 2026 (USD Million)
      4. 5.5.4. Asia Pacific 3D Scanner Market, By End-User, 2016 – 2026
        1. 5.5.4.1. Asia Pacific 3D Scanner Market, By End-User, 2016 – 2026 (USD Million)
      5. 5.5.5. China
        1. 5.5.5.1. China 3D Scanner Market, 2016 – 2026 (USD Million)
      6. 5.5.6. Japan
        1. 5.5.6.1. Japan 3D Scanner Market, 2016 – 2026 (USD Million)
      7. 5.5.7. India
        1. 5.5.7.1. India 3D Scanner Market, 2016 – 2026 (USD Million)
      8. 5.5.8. South Korea
        1. 5.5.8.1. South Korea 3D Scanner Market, 2016 – 2026 (USD Million)
      9. 5.5.9. Rest of Asia Pacific
        1. 5.5.9.1. Rest of Asia Pacific 3D Scanner Market, 2016 – 2026 (USD Million)
    6. 5.6. Latin America
      1. 5.6.1. Latin America 3D Scanner Market, 2016 – 2026 (USD Million)
        1. 5.6.1.1. Latin America 3D Scanner Market, by Country, 2016 - 2026 (USD Million)
      2. 5.6.2. Latin America 3D Scanner Market, By Component, 2016 – 2026
        1. 5.6.2.1. Latin America 3D Scanner Market, By Component, 2016 – 2026 (USD Million)
      3. 5.6.3. Latin America 3D Scanner Market, By Type, 2016 – 2026
        1. 5.6.3.1. Latin America 3D Scanner Market, By Type, 2016 – 2026 (USD Million)
      4. 5.6.4. Latin America 3D Scanner Market, By End-User, 2016 – 2026
        1. 5.6.4.1. Latin America 3D Scanner Market, By End-User, 2016 – 2026 (USD Million)
      5. 5.6.5. Brazil
        1. 5.6.5.1. Brazil 3D Scanner Market, 2016 – 2026 (USD Million)
      6. 5.6.6. Mexico
        1. 5.6.6.1. Mexico 3D Scanner Market, 2016 – 2026 (USD Million)
      7. 5.6.7. Rest of Latin America
        1. 5.6.7.1. Rest of Latin America 3D Scanner Market, 2016 – 2026 (USD Million)
    7. 5.7. The Middle-East and Africa
      1. 5.7.1. The Middle-East and Africa 3D Scanner Market, 2016 – 2026 (USD Million)
        1. 5.7.1.1. The Middle-East and Africa 3D Scanner Market, by Country, 2016 - 2026 (USD Million)
      2. 5.7.2. The Middle-East and Africa 3D Scanner Market, By Component, 2016 – 2026
        1. 5.7.2.1. The Middle-East and Africa 3D Scanner Market, By Component, 2016 – 2026 (USD Million)
      3. 5.7.3. The Middle-East and Africa 3D Scanner Market, By Type, 2016 – 2026
        1. 5.7.3.1. The Middle-East and Africa 3D Scanner Market, By Type, 2016 – 2026 (USD Million)
      4. 5.7.4. The Middle-East and Africa 3D Scanner Market, By End-User, 2016 – 2026
        1. 5.7.4.1. The Middle-East and Africa 3D Scanner Market, By End-User, 2016 – 2026 (USD Million)
      5. 5.7.5. GCC Countries
        1. 5.7.5.1. GCC Countries 3D Scanner Market, 2016 – 2026 (USD Million)
      6. 5.7.6. South Africa
        1. 5.7.6.1. South Africa 3D Scanner Market, 2016 – 2026 (USD Million)
      7. 5.7.7. Rest of Middle-East Africa
        1. 5.7.7.1. Rest of Middle-East Africa 3D Scanner Market, 2016 – 2026 (USD Million)
  6. Chapter 6 3D Scanner Market – Competitive Landscape
    1. 6.1. Competitor Market Share – Revenue
    2. 6.2. Market Concentration Rate Analysis, Top 3 and Top 5 Players
    3. 6.3. Strategic Developments
      1. 6.3.1. Acquisitions and Mergers
      2. 6.3.2. New Products
      3. 6.3.3. Research & Development Activities
  7. Chapter 7 Company Profiles
    1. 7.1. Faro Technologies, Inc.
      1. 7.1.1. Company Overview
      2. 7.1.2. Product/Service Portfolio
      3. 7.1.3. Faro Technologies, Inc. Sales, Revenue, and Gross Margin
      4. 7.1.4. Faro Technologies, Inc. Revenue and Growth Rate
      5. 7.1.5. Faro Technologies, Inc. Market Share
      6. 7.1.6. Recent Initiatives, Funding/VC Activities, and Technological Innovations
    2. 7.2. Creaform, Inc.
      1. 7.2.1. Company Overview
      2. 7.2.2. Product/Service Portfolio
      3. 7.2.3. Creaform, Inc. Sales, Revenue, and Gross Margin
      4. 7.2.4. Creaform, Inc. Revenue and Growth Rate
      5. 7.2.5. Creaform, Inc. Market Share
      6. 7.2.6. Recent Initiatives, Funding/VC Activities, and Technological Innovations
    3. 7.3. Direct Dimensions, Inc.
      1. 7.3.1. Company Overview
      2. 7.3.2. Product/Service Portfolio
      3. 7.3.3. Direct Dimensions, Inc. Sales, Revenue, and Gross Margin
      4. 7.3.4. Direct Dimensions, Inc. Revenue and Growth Rate
      5. 7.3.5. Direct Dimensions, Inc. Market Share
      6. 7.3.6. Recent Initiatives, Funding/VC Activities, and Technological Innovations
    4. 7.4. GOM GmbH
      1. 7.4.1. Company Overview
      2. 7.4.2. Product/Service Portfolio
      3. 7.4.3. GOM GmbH Sales, Revenue, and Gross Margin
      4. 7.4.4. GOM GmbH Revenue and Growth Rate
      5. 7.4.5. GOM GmbH Market Share
      6. 7.4.6. Recent Initiatives, Funding/VC Activities, and Technological Innovations
    5. 7.5. Konica Minolta, Inc.
      1. 7.5.1. Company Overview
      2. 7.5.2. Product/Service Portfolio
      3. 7.5.3. Konica Minolta, Inc. Sales, Revenue, and Gross Margin
      4. 7.5.4. Konica Minolta, Inc. Revenue and Growth Rate
      5. 7.5.5. Konica Minolta, Inc. Market Share
      6. 7.5.6. Recent Initiatives, Funding/VC Activities, and Technological Innovations
    6. 7.6. 3D Digital Corporation
      1. 7.6.1. Company Overview
      2. 7.6.2. Product/Service Portfolio
      3. 7.6.3. 3D Digital Corporation Sales, Revenue, and Gross Margin
      4. 7.6.4. 3D Digital Corporation Revenue and Growth Rate
      5. 7.6.5. 3D Digital Corporation Market Share
      6. 7.6.6. Recent Initiatives, Funding/VC Activities, and Technological Innovations
    7. 7.7. Autodesk, Inc.
      1. 7.7.1. Company Overview
      2. 7.7.2. Product/Service Portfolio
      3. 7.7.3. Autodesk, Inc. Sales, Revenue, and Gross Margin
      4. 7.7.4. Autodesk, Inc. Revenue and Growth Rate
      5. 7.7.5. Autodesk, Inc. Market Share
      6. 7.7.6. Recent Initiatives, Funding/VC Activities, and Technological Innovations
    8. 7.8. 3D Systems, Inc.
      1. 7.8.1. Company Overview
      2. 7.8.2. Product/Service Portfolio
      3. 7.8.3. 3D Systems, Inc. Sales, Revenue, and Gross Margin
      4. 7.8.4. 3D Systems, Inc. Revenue and Growth Rate
      5. 7.8.5. 3D Systems, Inc. Market Share
      6. 7.8.6. Recent Initiatives, Funding/VC Activities, and Technological Innovations
    9. 7.9. ShapeGrabber
      1. 7.9.1. Company Overview
      2. 7.9.2. Product/Service Portfolio
      3. 7.9.3. ShapeGrabber Sales, Revenue, and Gross Margin
      4. 7.9.4. ShapeGrabber Revenue and Growth Rate
      5. 7.9.5. ShapeGrabber Market Share
      6. 7.9.6. Recent Initiatives, Funding/VC Activities, and Technological Innovations
    10. 7.10. Maptek Pty Ltd
      1. 7.10.1. Company Overview
      2. 7.10.2. Product/Service Portfolio
      3. 7.10.3. Maptek Pty Ltd Sales, Revenue, and Gross Margin
      4. 7.10.4. Maptek Pty Ltd Revenue and Growth Rate
      5. 7.10.5. Maptek Pty Ltd Market Share
      6. 7.10.6. Recent Initiatives, Funding/VC Activities, and Technological Innovations
  8. Chapter 8 3D Scanner — Industry Analysis
    1. 8.1. Introduction and Taxonomy
    2. 8.2. 3D Scanner Market – Key Trends
      1. 8.2.1. Market Drivers
      2. 8.2.2. Market Restraints
      3. 8.2.3. Market Opportunities
    3. 8.3. Value Chain Analysis
    4. 8.4. Key Mandates and Regulations
    5. 8.5. Technology Roadmap and Timeline
    6. 8.6. 3D Scanner Market – Attractiveness Analysis
      1. 8.6.1. By Component
      2. 8.6.2. By Type
      3. 8.6.3. By End-User
      4. 8.6.4. By Region
  9. Chapter 9 Industrial Chain, Sourcing Strategy, and Downstream Buyers
    1. 9.1. 3D Scanner Industrial Chain Analysis
    2. 9.2. Downstream Buyers
    3. 9.3. Distributors/Traders List
  10. Chapter 10 Marketing Strategy Analysis
    1. 10.1. Marketing Channel
    2. 10.2. Direct Marketing
    3. 10.3. Indirect Marketing
    4. 10.4. Marketing Channel Development Trends
    5. 10.5. Economic/Political Environmental Change
  11. Chapter 11 Report Conclusion & Key Insights
    1. 11.1. Key Insights from Primary Interviews & Surveys Respondents
    2. 11.2. Key Takeaways from Analysts, Consultants, and Industry Leaders
  12. Chapter 12 Research Approach & Methodology
    1. 12.1. Report Description
    2. 12.2. Research Scope
    3. 12.3. Research Methodology
      1. 12.3.1. Secondary Research
      2. 12.3.2. Primary Research
      3. 12.3.3. Statistical Models
        1. 12.3.3.1. Company Share Analysis Model
        2. 12.3.3.2. Revenue Based Modeling
      4. 12.3.4. Research Limitations

      List of Figures

      Fig.1 Product Picture of 3D Scanner
      Fig.2 Global 3D Scanner Market, 2016 – 2026 (USD Million)
      Fig.3 Global 3D Scanner Market Absolute Revenue Opportunity, 2016 – 2026 (USD Million)
      Fig.4 Global 3D Scanner Market Incremental Revenue Opportunity, 2020 – 2026 (USD Million)
      Fig.5 Global 3D Scanner Market Share, By Component, 2019 & 2026 (USD Million)
      Fig.6 Global Hardware 3D Scanner Market, 2016 – 2026 (USD Million)
      Fig.7 Global Software 3D Scanner Market, 2016 – 2026 (USD Million)
      Fig.8 Global Services 3D Scanner Market, 2016 – 2026 (USD Million)
      Fig.9 Global 3D Scanner Market Share, By Type, 2019 & 2026 (USD Million)
      Fig.10 Global Portable 3D Scanner Market, 2016 – 2026 (USD Million)
      Fig.11 Global Desktop Based 3D Scanner Market, 2016 – 2026 (USD Million)
      Fig.12 Global Fixed Mount 3D Scanner Market, 2016 – 2026 (USD Million)
      Fig.13 Global Robot Mount 3D Scanner Market, 2016 – 2026 (USD Million)
      Fig.14 Global 3D Scanner Market Share, By End-User, 2019 & 2026 (USD Million)
      Fig.15 Global Automotive 3D Scanner Market, 2016 – 2026 (USD Million)
      Fig.16 Global Healthcare 3D Scanner Market, 2016 – 2026 (USD Million)
      Fig.17 Global Aerospace & Defense 3D Scanner Market, 2016 – 2026 (USD Million)
      Fig.18 Global Education 3D Scanner Market, 2016 – 2026 (USD Million)
      Fig.19 Global Manufacturing 3D Scanner Market, 2016 – 2026 (USD Million)
      Fig.20 Global Media & Entertainment 3D Scanner Market, 2016 – 2026 (USD Million)
      Fig.21 Global Others 3D Scanner Market, 2016 – 2026 (USD Million)
      Fig.22 Global 3D Scanner Market Share, by Region, 2019 & 2026 (USD Million)
      Fig.23 North America 3D Scanner Market, 2016 – 2026 (USD Million)
      Fig.24 U.S. 3D Scanner Market, 2016 – 2026 (USD Million)
      Fig.25 Canada 3D Scanner Market, 2016 – 2026 (USD Million)
      Fig.26 Europe 3D Scanner Market, 2016 – 2026 (USD Million)
      Fig.27 Germany 3D Scanner Market, 2016 – 2026 (USD Million)
      Fig.28 France 3D Scanner Market, 2016 – 2026 (USD Million)
      Fig.29 U.K. 3D Scanner Market, 2016 – 2026 (USD Million)
      Fig.30 Italy 3D Scanner Market, 2016 – 2026 (USD Million)
      Fig.31 Rest of Europe 3D Scanner Market, 2016 – 2026 (USD Million)
      Fig.32 Asia Pacific 3D Scanner Market, 2016 – 2026 (USD Million)
      Fig.33 China 3D Scanner Market, 2016 – 2026 (USD Million)
      Fig.34 Japan 3D Scanner Market, 2016 – 2026 (USD Million)
      Fig.35 India 3D Scanner Market, 2016 – 2026 (USD Million)
      Fig.36 South  Korea 3D Scanner Market, 2016 – 2026 (USD Million)
      Fig.37 Rest of Asia Pacific 3D Scanner Market, 2016 – 2026 (USD Million)
      Fig.38 Latin America 3D Scanner Market, 2016 – 2026 (USD Million)
      Fig.39 Brazil 3D Scanner Market, 2016 – 2026 (USD Million)
      Fig.40 Mexico 3D Scanner Market, 2016 – 2026 (USD Million)
      Fig.41 Rest of Latin America 3D Scanner Market, 2016 – 2026 (USD Million)
      Fig.42 The Middle-East and Africa 3D Scanner Market, 2016 – 2026 (USD Million)
      Fig.43 GCC Countries 3D Scanner Market, 2016 – 2026 (USD Million)
      Fig.44 South Africa 3D Scanner Market, 2016 – 2026 (USD Million)
      Fig.45 Rest of Middle-East Africa 3D Scanner Market, 2016 – 2026 (USD Million)
      Fig.46 Competitor Market Share – Revenue
      Fig.47 Faro Technologies, Inc. Revenue and Growth Rate
      Fig.48 Faro Technologies, Inc. Market Share
      Fig.49 Creaform, Inc. Revenue and Growth Rate
      Fig.50 Creaform, Inc. Market Share
      Fig.51 Direct Dimensions, Inc. Revenue and Growth Rate
      Fig.52 Direct Dimensions, Inc. Market Share
      Fig.53 GOM GmbH Revenue and Growth Rate
      Fig.54 GOM GmbH Market Share
      Fig.55 Konica Minolta, Inc. Revenue and Growth Rate
      Fig.56 Konica Minolta, Inc. Market Share
      Fig.57 3D Digital Corporation Revenue and Growth Rate
      Fig.58 3D Digital Corporation Market Share
      Fig.59 Autodesk, Inc. Revenue and Growth Rate
      Fig.60 Autodesk, Inc. Market Share
      Fig.61 3D Systems, Inc. Revenue and Growth Rate
      Fig.62 3D Systems, Inc. Market Share
      Fig.63 ShapeGrabber Revenue and Growth Rate
      Fig.64 ShapeGrabber Market Share
      Fig.65 Maptek Pty Ltd Revenue and Growth Rate
      Fig.66 Maptek Pty Ltd Market Share
      Fig.67 Market Dynamics
      Fig.68 Global 3D Scanner – Value Chain Analysis
      Fig.69 Key Mandates and Regulations
      Fig.70 Technology Roadmap and Timeline
      Fig.71 Market Attractiveness Analysis – By Component
      Fig.72 Market Attractiveness Analysis – By Type
      Fig.73 Market Attractiveness Analysis – By End-User
      Fig.74 Market Attractiveness Analysis – By Region
      Fig.75 3D Scanner Industrial Chain Analysis
      Fig.76 Market Channels
      Fig.77 Marketing Channel Development Trend
      Fig.78 Growth in World Gross Product, 2008-2018
      

      List of Tables

      Table 1 Global 3D Scanner Market, 2019 & 2026 (USD Million)
      Table 2 Global 3D Scanner Market, By Component, 2016 – 2026 (USD Million)
      Table 3 Global 3D Scanner Market, By Type, 2016 – 2026 (USD Million)
      Table 4 Global 3D Scanner Market, By End-User, 2016 – 2026 (USD Million)
      Table 5 Global 3D Scanner Market, by Region, 2016 – 2026 (USD Million)
      Table 6 North America 3D Scanner Market, by Country, 2016 – 2026 (USD Million)
      Table 7 North America 3D Scanner Market, By Component, 2016 – 2026 (USD Million)
      Table 8 North America 3D Scanner Market, By Type, 2016 – 2026 (USD Million)
      Table 9 North America 3D Scanner Market, By End-User, 2016 – 2026 (USD Million)
      Table 10 Europe 3D Scanner Market, by Country, 2016 – 2026 (USD Million)
      Table 11 Europe 3D Scanner Market, By Component, 2016 – 2026 (USD Million)
      Table 12 Europe 3D Scanner Market, By Type, 2016 – 2026 (USD Million)
      Table 13 Europe 3D Scanner Market, By End-User, 2016 – 2026 (USD Million)
      Table 14 Asia Pacific 3D Scanner Market, by Country, 2016 – 2026 (USD Million)
      Table 15 Asia Pacific 3D Scanner Market, By Component, 2016 – 2026 (USD Million)
      Table 16 Asia Pacific 3D Scanner Market, By Type, 2016 – 2026 (USD Million)
      Table 17 Asia Pacific 3D Scanner Market, By End-User, 2016 – 2026 (USD Million)
      Table 18 Latin America 3D Scanner Market, by Country, 2016 – 2026 (USD Million)
      Table 19 Latin America 3D Scanner Market, By Component, 2016 – 2026 (USD Million)
      Table 20 Latin America 3D Scanner Market, By Type, 2016 – 2026 (USD Million)
      Table 21 Latin America 3D Scanner Market, By End-User, 2016 – 2026 (USD Million)
      Table 22 The Middle-East and Africa 3D Scanner Market, by Country, 2016 – 2026 (USD Million)
      Table 23 The Middle-East and Africa 3D Scanner Market, By Component, 2016 – 2026 (USD Million)
      Table 24 The Middle-East and Africa 3D Scanner Market, By Type, 2016 – 2026 (USD Million)
      Table 25 The Middle-East and Africa 3D Scanner Market, By End-User, 2016 – 2026 (USD Million)
      Table 26 Global 3D Scanner Market - Company Revenue Analysis, 2016 – 2019 (USD Million)
      Table 27 Global 3D Scanner Market - Company Revenue Share Analysis, 2016 – 2019 (%)
      Table 28 Acquisitions and Mergers
      Table 29 Market Drivers – Impact Analysis
      Table 30 Market Restraints
      Table 31 Market Opportunities
      Table 32 Major Buyers of 3D Scanner
      Table 33 Distributors/Traders of 3D Scanner by Region
      

Industry Major Market Players

  • Hexagon AB
  • 3D Digital Corporation
  • Faro Technologies
  • Riegl Laser Measurement Systems GmbH
  • Creaform Inc.
  • Carl Zeiss Optotechnik GmbH
  • Nikon Metrology
  • Perceptron Inc.
  • Trimble Navigation Ltd.
  • Ametek
  • GOM GmbH
  • Maptek
  • Topcon Corporation