Search Market Research Report

Discover Our Latest Reports
Discover Our Featured Reports
Discover Top Selling Reports

3D Printed Medical Devices Market Size, Share Global Analysis Report, 2021 – 2026

report img

3D Printed Medical Devices Market By Component (Software & Services, 3D Printers & 3D Bioprinters, Material, & Others), By Type (Surgical Guides, Dental Guides, Craniomaxillofacial Guides, Orthopedic Guides, Surgical Instrument, & Retractors), By Technology (Laser Beam Melting (LBM) Technology, Electronic Beam Melting (EMB) Technology, Selective Layer Sintering (SLS) Technology, Photopolymerization, Selective Laser Melting (SLM) Technology, Fused Deposition Modelling (FDM) Technology, & Direct Metal Laser Sintering (DMLS) Technology), By End-Users (Medical & Surgical Centers, Pharmaceutical and Biotechnological Companies, & Academic Institutions), and By Regions - Global and Regional Industry Perspective, Comprehensive Analysis, and Forecast 2021 – 2026

Industry Insights

[191+ Pages Report] As per the latest research and survey report issued by Facts and Factors, the global 3D printed medical devices market was valued at around USD 1.9 Billion in 2020 and is expected to register revenues worth USD 4 Billion by the end of 2026, growing at an exceptional CAGR of approximately 17% between 2021 and 2026.

logoMarket Overview

3D printed medical devices are devices that mimic the use and application of traditional medical devices built using a 3D printed manufacturing process. 3D printing refers to creating a structure using a digital file using layers of specialized ink. A 3D printer fuses together the final shape and texture of the medical device using data read from the digital file, design, and size. Initially, this technology was limited to building prosthetics and implants in the medical industry, however, with an increase in technological developments human tissue and components can also be recreated with near-perfect functionality.

3D Printed Medical Devices Market

To know more about this report | Request Free Sample Copy

logoGlobal 3D Printed Medical Device Market: Growth Factors

The recent technological boom in 3D printed medical devices is responsible for the sudden surge in the market. Orthopedic and dental industries have gained the most advantage by custom-built 3D structures which can be used for replacement purposes organically. Additionally, these structures allow for a long-lasting and better fit than traditional ceramic-based implants. With the advent of technological leaps made in 3D printing and material utilization, a variety of implants and devices can be concocted using this technology. The use of computer-aided manufacturing software and an optimal price will further open opportunities for the 3D printed medical device market to grow during the forecast period.

An increase in personalized surgeries for relief and aesthetic purposes will further drive the market value for 3D printed medical device market. Furthermore, the advent of customizable medical products with constant product changes will drive market growth in a positive manner. Additionally, these products possess a far fewer operative risks as compared to traditional counterparts as they reduce risks of infections and decrease the aftereffects of long-term anesthesia. 3D printed medical implants can often be used as a guinea pig for drug trials as an alternative to animal testing. However, the high cost related to these devices and the lack of technical knowledge will hamper the growth of the market to a certain extent.

logoSegmentation Analysis

The global 3D printed medical devices market can be segmented on the basis of component, type, technology, end-user, and regions.

On the basis of components, the 3D printed medical devices market can be divided into software & services, 3D printers & 3D bioprinters, material, and others. The material segment can be further bifurcated into plastics, biomaterials, metals & alloys. The software and services segment accounts for the largest market share in terms of revenue generation owing to an increase of advent in technological advancements for the production of higher quality 3D printed medical devices. On the basis of type, the 3D printed medical devices market can be divided into surgical guides, dental guides, craniomaxillofacial guides, orthopedic guides, surgical instruments, and retractors. Surgical guides are expected to witness the highest market share during the forecast period owing to improved accuracy of 3D printed medical devices over their traditional counterparts and accurate implant restoration abilities. On the basis of technology, the 3D printed medical devices market can be divided into laser beam melting (LBM) technology, electronic beam melting (EMB) technology, selective layer sintering (SLS), photopolymerization, selective laser melting (SLM), fused deposition modeling (FDM) and direct metal laser sintering (DMLS). Photopolymerization is expected to witness the highest market share during the forecast period owing to an exponential growth of technology across the medical sector in terms of processing similar applications. On the basis of end-users, the 3D printed medical devices market can be divided into medical & surgical centers, pharmaceutical and biotechnological companies, and academic institutions.

logo Regional Analysis

The region of Asia-Pacific is expected to witness the largest market share during the forecast period. Certain factors owing to a high rise in revenue generation in the 3D printed market, increased workforce of technical and skilled workers in the field, implementation of new 3D printing research centers, and establishment of reliable vendors in the region will further push the growth of the market in the region. An increased need of the application for 3D printed medical parts and implants for the growing population will further open opportunities for the 3D printed medical devices market to flourish. The region of North America is expected to occupy a huge market share on a global scale owing to increased technological advancements and developmental activities in the region.

logoReport Scope

Report Attribute

Details

Market Size in 2020

USD 1.9 Billion

Projected Market Size in 2026

USD 4 Billion

Growth Rate

CAGR 17%

Base Year

2020

Forecast Years

2021–2026

Key Market Players

Stratasys Ltd., 3D Systems Corporation, Materialise NV, Concept Laser GmbH, Arcam AB, Biomedical Modelling, Inc., Organovo Holdings, Inc., Renishaw Plc, 3T RPD Ltd., Prodways Groups, EOS GmbH Electro Optical Systems, and Envisiontec GmbH, among others.

Key Segment

By Type, By Component, By Technology, By End-Users, and By Region

Major Regions Covered

North America, Europe, Asia Pacific, Latin America, and the Middle East & Africa

Purchase Options

Request customized purchase options to meet your research needs. Explore purchase options

logo Competitive Players

The major players in the 3D printed medical devices market are

  • Stratasys Ltd.
  • 3D Systems Corporation
  • Materialise NV
  • Concept Laser GmbH
  • Arcam AB
  • Biomedical Modelling Inc.
  • Organovo Holdings Inc.
  • Renishaw Plc
  • 3T RPD Ltd.
  • Prodways Groups
  • EOS GmbH Electro Optical Systems
  • Envisiontec GmbH
  • among others.

logo By Component Segment Analysis

  • Software & Services
  • 3D Printers & 3D Bioprinters
  • Material
    • Plastics
    • Biomaterials
    • Metals & alloys
  • Others

logo By Type Segment Analysis

  • Surgical Guides
  • Dental Guides
  • Craniomaxillofacial Guides
  • Orthopedic Guides
  • Surgical Instrument
  • Retractors

logoGlobal 3D Printed Medical Device Market: By Technology Segment Analysis

  • Laser Beam Melting (LBM) Technology
  • Electronic Beam Melting (EMB) Technology
  • Selective Layer Sintering (SLS) Technology
  • Photopolymerization
  • Selective Laser Melting (SLM) Technology
  • Fused Deposition Modelling (FDM) Technology
  • Direct Metal Laser Sintering (DMLS) Technology

logoGlobal 3D Printed Medical Device Market: By End-User Segment Analysis

  • Medical & Surgical Centres
  • Pharmaceutical & Biotechnological Companies
  • Academic Institutions

logoGlobal 3D Printed Medical Device Market: By Regional Segment Analysis

  • North America
    • U.S.
    • Canada
  • Europe
    • UK
    • France
    • Germany
    • Italy
    • Spain
    • Rest of Europe
  • Asia Pacific
    • China
    • Japan
    • India
    • South Korea
    • Southeast Asia
    • Rest of Asia Pacific
  • Latin America
    • Brazil
    • Mexico
    • Rest of Latin America
  • Middle East and Africa
    • GCC Countries
    • South Africa
    • Rest of MEA

Table of Content

  1. Chapter 1 Executive Summary
    1. 1.1. Introduction of 3D Printed Medical Devices
    2. 1.2. Global 3D Printed Medical Devices Market, 2020 & 2026 (USD Billion)
    3. 1.3. Global 3D Printed Medical Devices Market, 2016 – 2026 (USD Billion)
    4. 1.4. Global 3D Printed Medical Devices Market Absolute Revenue Opportunity, 2016 – 2026 (USD Billion)
    5. 1.5. Global 3D Printed Medical Devices Market Incremental Revenue Opportunity, 2020 – 2026 (USD Billion)
  2. Chapter 2 3D Printed Medical Devices Market – Component Analysis
    1. 2.1. Global 3D Printed Medical Devices Market – Component Overview
    2. 2.2. Global 3D Printed Medical Devices Market Share, by Component, 2020 & 2026 (USD Billion)
    3. 2.3. Global 3D Printed Medical Devices Market share, by Component, 2020 & 2026
    4. 2.4. Software & Services
      1. 2.4.1. Global Software & Services 3D Printed Medical Devices Market, 2016 – 2026 (USD Billion)
      2. 2.4.2. Global Software & Services 3D Printed Medical Devices Market, 2016 – 2026
    5. 2.5. 3D Printers & 3D Bioprinters
      1. 2.5.1. Global 3D Printers & 3D Bioprinters 3D Printed Medical Devices Market, 2016 – 2026 (USD Billion)
      2. 2.5.2. Global 3D Printers & 3D Bioprinters 3D Printed Medical Devices Market, 2016 – 2026
    6. 2.6. Material
      1. 2.6.1. Global Material 3D Printed Medical Devices Market, 2016 – 2026 (USD Billion)
      2. 2.6.2. Global Material 3D Printed Medical Devices Market, 2016 – 2026
    7. 2.7. Others
      1. 2.7.1. Global Others 3D Printed Medical Devices Market, 2016 – 2026 (USD Billion)
      2. 2.7.2. Global Others 3D Printed Medical Devices Market, 2016 – 2026
  3. Chapter 3 3D Printed Medical Devices Market – Type Analysis
    1. 3.1. Global 3D Printed Medical Devices Market – Type Overview
    2. 3.2. Global 3D Printed Medical Devices Market Share, by Type, 2020 & 2026 (USD Billion)
    3. 3.3. Global 3D Printed Medical Devices Market share, by Type, 2020 & 2026
    4. 3.4. Surgical Guides
      1. 3.4.1. Global Surgical Guides 3D Printed Medical Devices Market, 2016 – 2026 (USD Billion)
      2. 3.4.2. Global Surgical Guides 3D Printed Medical Devices Market, 2016 – 2026
    5. 3.5. Dental Guides
      1. 3.5.1. Global Dental Guides 3D Printed Medical Devices Market, 2016 – 2026 (USD Billion)
      2. 3.5.2. Global Dental Guides 3D Printed Medical Devices Market, 2016 – 2026
    6. 3.6. Craniomaxillofacial Guides
      1. 3.6.1. Global Craniomaxillofacial Guides 3D Printed Medical Devices Market, 2016 – 2026 (USD Billion)
      2. 3.6.2. Global Craniomaxillofacial Guides 3D Printed Medical Devices Market, 2016 – 2026
    7. 3.7. Orthopedic Guides
      1. 3.7.1. Global Orthopedic Guides 3D Printed Medical Devices Market, 2016 – 2026 (USD Billion)
      2. 3.7.2. Global Orthopedic Guides 3D Printed Medical Devices Market, 2016 – 2026
    8. 3.8. Surgical Instrument
      1. 3.8.1. Global Surgical Instrument 3D Printed Medical Devices Market, 2016 – 2026 (USD Billion)
      2. 3.8.2. Global Surgical Instrument 3D Printed Medical Devices Market, 2016 – 2026
    9. 3.9. Retractors
      1. 3.9.1. Global Retractors 3D Printed Medical Devices Market, 2016 – 2026 (USD Billion)
      2. 3.9.2. Global Retractors 3D Printed Medical Devices Market, 2016 – 2026 ()
  4. Chapter 4 3D Printed Medical Devices Market – Technology Analysis
    1. 4.1. Global 3D Printed Medical Devices Market – Technology Overview
    2. 4.2. Global 3D Printed Medical Devices Market Share, by Technology, 2020 & 2026 (USD Billion)
    3. 4.3. Global 3D Printed Medical Devices Market share, by Technology, 2020 & 2026 ()
    4. 4.4. Laser Beam Melting (LBM) Technology
      1. 4.4.1. Global Laser Beam Melting (LBM) Technology 3D Printed Medical Devices Market, 2016 – 2026 (USD Billion)
      2. 4.4.2. Global Laser Beam Melting (LBM) Technology 3D Printed Medical Devices Market, 2016 – 2026 ()
    5. 4.5. Electronic Beam Melting (EMB) Technology
      1. 4.5.1. Global Electronic Beam Melting (EMB) Technology 3D Printed Medical Devices Market, 2016 – 2026 (USD Billion)
      2. 4.5.2. Global Electronic Beam Melting (EMB) Technology 3D Printed Medical Devices Market, 2016 – 2026 ()
    6. 4.6. Selective Layer Sintering (SLS) Technology
      1. 4.6.1. Global Selective Layer Sintering (SLS) Technology 3D Printed Medical Devices Market, 2016 – 2026 (USD Billion)
      2. 4.6.2. Global Selective Layer Sintering (SLS) Technology 3D Printed Medical Devices Market, 2016 – 2026 ()
    7. 4.7. Photopolymerization
      1. 4.7.1. Global Photopolymerization 3D Printed Medical Devices Market, 2016 – 2026 (USD Billion)
      2. 4.7.2. Global Photopolymerization 3D Printed Medical Devices Market, 2016 – 2026 ()
    8. 4.8. Selective Laser Melting (SLM) Technology
      1. 4.8.1. Global Selective Laser Melting (SLM) Technology 3D Printed Medical Devices Market, 2016 – 2026 (USD Billion)
      2. 4.8.2. Global Selective Laser Melting (SLM) Technology 3D Printed Medical Devices Market, 2016 – 2026 ()
    9. 4.9. Fused Deposition Modelling (FDM) Technology
      1. 4.9.1. Global Fused Deposition Modelling (FDM) Technology 3D Printed Medical Devices Market, 2016 – 2026 (USD Billion)
      2. 4.9.2. Global Fused Deposition Modelling (FDM) Technology 3D Printed Medical Devices Market, 2016 – 2026 ()
    10. 4.10. Direct Metal Laser Sintering (DMLS) Technology
      1. 4.10.1. Global Direct Metal Laser Sintering (DMLS) Technology 3D Printed Medical Devices Market, 2016 – 2026 (USD Billion)
      2. 4.10.2. Global Direct Metal Laser Sintering (DMLS) Technology 3D Printed Medical Devices Market, 2016 – 2026 ()
  5. Chapter 5 3D Printed Medical Devices Market – End-Users Analysis
    1. 5.1. Global 3D Printed Medical Devices Market – End-Users Overview
    2. 5.2. Global 3D Printed Medical Devices Market Share, by End-Users, 2020 & 2026 (USD Billion)
    3. 5.3. Global 3D Printed Medical Devices Market share, by End-Users, 2020 & 2026 ()
    4. 5.4. Medical & Surgical Centers
      1. 5.4.1. Global Medical & Surgical Centers 3D Printed Medical Devices Market, 2016 – 2026 (USD Billion)
      2. 5.4.2. Global Medical & Surgical Centers 3D Printed Medical Devices Market, 2016 – 2026 ()
    5. 5.5. Pharmaceutical and Biotechnological Companies
      1. 5.5.1. Global Pharmaceutical and Biotechnological Companies 3D Printed Medical Devices Market, 2016 – 2026 (USD Billion)
      2. 5.5.2. Global Pharmaceutical and Biotechnological Companies 3D Printed Medical Devices Market, 2016 – 2026 ()
    6. 5.6. Academic Institutions
      1. 5.6.1. Global Academic Institutions 3D Printed Medical Devices Market, 2016 – 2026 (USD Billion)
      2. 5.6.2. Global Academic Institutions 3D Printed Medical Devices Market, 2016 – 2026 ()
  6. Chapter 6 3D Printed Medical Devices Market – Regional Analysis
    1. 6.1. Global 3D Printed Medical Devices Market Regional Overview
    2. 6.2. Global 3D Printed Medical Devices Market Share, by Region, 2020 & 2026 (USD Billion)
    3. 6.3. Global 3D Printed Medical Devices Market Share, by Region, 2020 & 2026 ()
    4. 6.4. North America
      1. 6.4.1. North America 3D Printed Medical Devices Market, 2016 – 2026 (USD Billion)
        1. 6.4.1.1. North America 3D Printed Medical Devices Market, by Country, 2016 – 2026 (USD Billion)
      2. 6.4.2. North America Market, 2016 – 2026 ()
        1. 6.4.2.1. North America 3D Printed Medical Devices Market, by Country, 2016 – 2026 ()
      3. 6.4.3. North America 3D Printed Medical Devices Market, by Component, 2016 – 2026
        1. 6.4.3.1. North America 3D Printed Medical Devices Market, by Component, 2016 – 2026 (USD Billion)
        2. 6.4.3.2. North America 3D Printed Medical Devices Market, by Component, 2016 – 2026 ()
      4. 6.4.4. North America 3D Printed Medical Devices Market, by Type, 2016 – 2026
        1. 6.4.4.1. North America 3D Printed Medical Devices Market, by Type, 2016 – 2026 (USD Billion)
        2. 6.4.4.2. North America 3D Printed Medical Devices Market, by Type, 2016 – 2026 ()
      5. 6.4.5. North America 3D Printed Medical Devices Market, by Technology, 2016 – 2026
        1. 6.4.5.1. North America 3D Printed Medical Devices Market, by Technology, 2016 – 2026 (USD Billion)
        2. 6.4.5.2. North America 3D Printed Medical Devices Market, by Technology, 2016 – 2026 ()
      6. 6.4.6. North America 3D Printed Medical Devices Market, by End-Users, 2016 – 2026
        1. 6.4.6.1. North America 3D Printed Medical Devices Market, by End-Users, 2016 – 2026 (USD Billion)
        2. 6.4.6.2. North America 3D Printed Medical Devices Market, by End-Users, 2016 – 2026 ()
      7. 6.4.7. U.S.
        1. 6.4.7.1. U.S. 3D Printed Medical Devices Market, 2016 – 2026 (USD Billion)
        2. 6.4.7.2. U.S. 3D Printed Medical Devices Market, 2016 – 2026 ()
      8. 6.4.8. Canada
        1. 6.4.8.1. Canada 3D Printed Medical Devices Market, 2016 – 2026 (USD Billion)
        2. 6.4.8.2. Canada 3D Printed Medical Devices Market, 2016 – 2026 ()
    5. 6.5. Europe
      1. 6.5.1. Europe 3D Printed Medical Devices Market, 2016 – 2026 (USD Billion)
        1. 6.5.1.1. Europe 3D Printed Medical Devices Market, by Country, 2016 – 2026 (USD Billion)
      2. 6.5.2. Europe Market, 2016 – 2026 ()
        1. 6.5.2.1. Europe 3D Printed Medical Devices Market, by Country, 2016 – 2026 ()
      3. 6.5.3. Europe 3D Printed Medical Devices Market, by Component, 2016 – 2026
        1. 6.5.3.1. Europe 3D Printed Medical Devices Market, by Component, 2016 – 2026 (USD Billion)
        2. 6.5.3.2. Europe 3D Printed Medical Devices Market, by Component, 2016 – 2026 ()
      4. 6.5.4. Europe 3D Printed Medical Devices Market, by Type, 2016 – 2026
        1. 6.5.4.1. Europe 3D Printed Medical Devices Market, by Type, 2016 – 2026 (USD Billion)
        2. 6.5.4.2. Europe 3D Printed Medical Devices Market, by Type, 2016 – 2026 ()
      5. 6.5.5. Europe 3D Printed Medical Devices Market, by Technology, 2016 – 2026
        1. 6.5.5.1. Europe 3D Printed Medical Devices Market, by Technology, 2016 – 2026 (USD Billion)
        2. 6.5.5.2. Europe 3D Printed Medical Devices Market, by Technology, 2016 – 2026 ()
      6. 6.5.6. Europe 3D Printed Medical Devices Market, by End-Users, 2016 – 2026
        1. 6.5.6.1. Europe 3D Printed Medical Devices Market, by End-Users, 2016 – 2026 (USD Billion)
        2. 6.5.6.2. Europe 3D Printed Medical Devices Market, by End-Users, 2016 – 2026 ()
      7. 6.5.7. Germany
        1. 6.5.7.1. Germany 3D Printed Medical Devices Market, 2016 – 2026 (USD Billion)
        2. 6.5.7.2. Germany 3D Printed Medical Devices Market, 2016 – 2026 ()
      8. 6.5.8. France
        1. 6.5.8.1. France 3D Printed Medical Devices Market, 2016 – 2026 (USD Billion)
        2. 6.5.8.2. France 3D Printed Medical Devices Market, 2016 – 2026 ()
      9. 6.5.9. U.K.
        1. 6.5.9.1. U.K. 3D Printed Medical Devices Market, 2016 – 2026 (USD Billion)
        2. 6.5.9.2. U.K. 3D Printed Medical Devices Market, 2016 – 2026 ()
      10. 6.5.10. Italy
        1. 6.5.10.1. Italy 3D Printed Medical Devices Market, 2016 – 2026 (USD Billion)
        2. 6.5.10.2. Italy 3D Printed Medical Devices Market, 2016 – 2026 ()
      11. 6.5.11. Spain
        1. 6.5.11.1. Spain 3D Printed Medical Devices Market, 2016 – 2026 (USD Billion)
        2. 6.5.11.2. Spain 3D Printed Medical Devices Market, 2016 – 2026 ()
      12. 6.5.12. Rest of Europe
        1. 6.5.12.1. Rest of Europe 3D Printed Medical Devices Market, 2016 – 2026 (USD Billion)
        2. 6.5.12.2. Rest of Europe 3D Printed Medical Devices Market, 2016 – 2026 ()
    6. 6.6. Asia Pacific
      1. 6.6.1. Asia Pacific 3D Printed Medical Devices Market, 2016 – 2026 (USD Billion)
        1. 6.6.1.1. Asia Pacific 3D Printed Medical Devices Market, by Country, 2016 – 2026 (USD Billion)
      2. 6.6.2. Asia Pacific Market, 2016 – 2026 ()
        1. 6.6.2.1. Asia Pacific 3D Printed Medical Devices Market, by Country, 2016 – 2026 ()
      3. 6.6.3. Asia Pacific 3D Printed Medical Devices Market, by Component, 2016 – 2026
        1. 6.6.3.1. Asia Pacific 3D Printed Medical Devices Market, by Component, 2016 – 2026 (USD Billion)
        2. 6.6.3.2. Asia Pacific 3D Printed Medical Devices Market, by Component, 2016 – 2026 ()
      4. 6.6.4. Asia Pacific 3D Printed Medical Devices Market, by Type, 2016 – 2026
        1. 6.6.4.1. Asia Pacific 3D Printed Medical Devices Market, by Type, 2016 – 2026 (USD Billion)
        2. 6.6.4.2. Asia Pacific 3D Printed Medical Devices Market, by Type, 2016 – 2026 ()
      5. 6.6.5. Asia Pacific 3D Printed Medical Devices Market, by Technology, 2016 – 2026
        1. 6.6.5.1. Asia Pacific 3D Printed Medical Devices Market, by Technology, 2016 – 2026 (USD Billion)
        2. 6.6.5.2. Asia Pacific 3D Printed Medical Devices Market, by Technology, 2016 – 2026 ()
      6. 6.6.6. Asia Pacific 3D Printed Medical Devices Market, by End-Users, 2016 – 2026
        1. 6.6.6.1. Asia Pacific 3D Printed Medical Devices Market, by End-Users, 2016 – 2026 (USD Billion)
        2. 6.6.6.2. Asia Pacific 3D Printed Medical Devices Market, by End-Users, 2016 – 2026 ()
      7. 6.6.7. China
        1. 6.6.7.1. China 3D Printed Medical Devices Market, 2016 – 2026 (USD Billion)
        2. 6.6.7.2. China 3D Printed Medical Devices Market, 2016 – 2026 ()
      8. 6.6.8. Japan
        1. 6.6.8.1. Japan 3D Printed Medical Devices Market, 2016 – 2026 (USD Billion)
        2. 6.6.8.2. Japan 3D Printed Medical Devices Market, 2016 – 2026 ()
      9. 6.6.9. India
        1. 6.6.9.1. India 3D Printed Medical Devices Market, 2016 – 2026 (USD Billion)
        2. 6.6.9.2. India 3D Printed Medical Devices Market, 2016 – 2026 ()
      10. 6.6.10. South Korea
        1. 6.6.10.1. South Korea 3D Printed Medical Devices Market, 2016 – 2026 (USD Billion)
        2. 6.6.10.2. South Korea 3D Printed Medical Devices Market, 2016 – 2026 ()
      11. 6.6.11. South-East Asia
        1. 6.6.11.1. South-East Asia 3D Printed Medical Devices Market, 2016 – 2026 (USD Billion)
        2. 6.6.11.2. South-East Asia 3D Printed Medical Devices Market, 2016 – 2026 ()
      12. 6.6.12. Rest of Asia Pacific
        1. 6.6.12.1. Rest of Asia Pacific 3D Printed Medical Devices Market, 2016 – 2026 (USD Billion)
        2. 6.6.12.2. Rest of Asia Pacific 3D Printed Medical Devices Market, 2016 – 2026 ()
    7. 6.7. Latin America
      1. 6.7.1. Latin America 3D Printed Medical Devices Market, 2016 – 2026 (USD Billion)
        1. 6.7.1.1. Latin America 3D Printed Medical Devices Market, by Country, 2016 – 2026 (USD Billion)
      2. 6.7.2. Latin America Market, 2016 – 2026 ()
        1. 6.7.2.1. Latin America 3D Printed Medical Devices Market, by Country, 2016 – 2026 ()
      3. 6.7.3. Latin America 3D Printed Medical Devices Market, by Component, 2016 – 2026
        1. 6.7.3.1. Latin America 3D Printed Medical Devices Market, by Component, 2016 – 2026 (USD Billion)
        2. 6.7.3.2. Latin America 3D Printed Medical Devices Market, by Component, 2016 – 2026 ()
      4. 6.7.4. Latin America 3D Printed Medical Devices Market, by Type, 2016 – 2026
        1. 6.7.4.1. Latin America 3D Printed Medical Devices Market, by Type, 2016 – 2026 (USD Billion)
        2. 6.7.4.2. Latin America 3D Printed Medical Devices Market, by Type, 2016 – 2026 ()
      5. 6.7.5. Latin America 3D Printed Medical Devices Market, by Technology, 2016 – 2026
        1. 6.7.5.1. Latin America 3D Printed Medical Devices Market, by Technology, 2016 – 2026 (USD Billion)
        2. 6.7.5.2. Latin America 3D Printed Medical Devices Market, by Technology, 2016 – 2026 ()
      6. 6.7.6. Latin America 3D Printed Medical Devices Market, by End-Users, 2016 – 2026
        1. 6.7.6.1. Latin America 3D Printed Medical Devices Market, by End-Users, 2016 – 2026 (USD Billion)
        2. 6.7.6.2. Latin America 3D Printed Medical Devices Market, by End-Users, 2016 – 2026 ()
      7. 6.7.7. Brazil
        1. 6.7.7.1. Brazil 3D Printed Medical Devices Market, 2016 – 2026 (USD Billion)
        2. 6.7.7.2. Brazil 3D Printed Medical Devices Market, 2016 – 2026 ()
      8. 6.7.8. Mexico
        1. 6.7.8.1. Mexico 3D Printed Medical Devices Market, 2016 – 2026 (USD Billion)
        2. 6.7.8.2. Mexico 3D Printed Medical Devices Market, 2016 – 2026 ()
      9. 6.7.9. Rest of Latin America
        1. 6.7.9.1. Rest of Latin America 3D Printed Medical Devices Market, 2016 – 2026 (USD Billion)
        2. 6.7.9.2. Rest of Latin America 3D Printed Medical Devices Market, 2016 – 2026 ()
    8. 6.8. The Middle-East and Africa
      1. 6.8.1. The Middle-East and Africa 3D Printed Medical Devices Market, 2016 – 2026 (USD Billion)
        1. 6.8.1.1. The Middle-East and Africa 3D Printed Medical Devices Market, by Country, 2016 – 2026 (USD Billion)
      2. 6.8.2. The Middle-East and Africa Market, 2016 – 2026 ()
        1. 6.8.2.1. The Middle-East and Africa 3D Printed Medical Devices Market, by Country, 2016 – 2026 ()
      3. 6.8.3. The Middle-East and Africa 3D Printed Medical Devices Market, by Component, 2016 – 2026
        1. 6.8.3.1. The Middle-East and Africa 3D Printed Medical Devices Market, by Component, 2016 – 2026 (USD Billion)
        2. 6.8.3.2. The Middle-East and Africa 3D Printed Medical Devices Market, by Component, 2016 – 2026 ()
      4. 6.8.4. The Middle-East and Africa 3D Printed Medical Devices Market, by Type, 2016 – 2026
        1. 6.8.4.1. The Middle-East and Africa 3D Printed Medical Devices Market, by Type, 2016 – 2026 (USD Billion)
        2. 6.8.4.2. The Middle-East and Africa 3D Printed Medical Devices Market, by Type, 2016 – 2026 ()
      5. 6.8.5. The Middle-East and Africa 3D Printed Medical Devices Market, by Technology, 2016 – 2026
        1. 6.8.5.1. The Middle-East and Africa 3D Printed Medical Devices Market, by Technology, 2016 – 2026 (USD Billion)
        2. 6.8.5.2. The Middle-East and Africa 3D Printed Medical Devices Market, by Technology, 2016 – 2026 ()
      6. 6.8.6. The Middle-East and Africa 3D Printed Medical Devices Market, by End-Users, 2016 – 2026
        1. 6.8.6.1. The Middle-East and Africa 3D Printed Medical Devices Market, by End-Users, 2016 – 2026 (USD Billion)
        2. 6.8.6.2. The Middle-East and Africa 3D Printed Medical Devices Market, by End-Users, 2016 – 2026 ()
      7. 6.8.7. GCC Countries
        1. 6.8.7.1. GCC Countries 3D Printed Medical Devices Market, 2016 – 2026 (USD Billion)
        2. 6.8.7.2. GCC Countries 3D Printed Medical Devices Market, 2016 – 2026 ()
      8. 6.8.8. South Africa
        1. 6.8.8.1. South Africa 3D Printed Medical Devices Market, 2016 – 2026 (USD Billion)
        2. 6.8.8.2. South Africa 3D Printed Medical Devices Market, 2016 – 2026 ()
      9. 6.8.9. Rest of Middle-East Africa
        1. 6.8.9.1. Rest of Middle-East Africa 3D Printed Medical Devices Market, 2016 – 2026 (USD Billion)
        2. 6.8.9.2. Rest of Middle-East Africa 3D Printed Medical Devices Market, 2016 – 2026 ()
  7. Chapter 7 3D Printed Medical Devices Production, Consumption, Export, Import by Regions
    1. 7.1. Global 3D Printed Medical Devices Production and Consumption, 2016 – 2026 ()
    2. 7.2. Global Import and Export Analysis, by Region
  8. Chapter 8 3D Printed Medical Devices Market – Competitive Landscape
    1. 8.1. Competitor Market Share – Revenue
    2. 8.2. Market Concentration Rate Analysis, Top 3 and Top 5 Players
    3. 8.3. Competitor Market Share – Volume
    4. 8.4. Strategic Developments
      1. 8.4.1. Acquisitions and Mergers
      2. 8.4.2. New Products
      3. 8.4.3. Research & Development Activities
  9. Chapter 9 Company Profiles
    1. 9.1. Stratasys Ltd.
      1. 9.1.1. Company Overview
      2. 9.1.2. Product/Service Portfolio
      3. 9.1.3. Stratasys Ltd. Sales, Revenue, Price, and Gross Margin
      4. 9.1.4. Stratasys Ltd. Revenue and Growth Rate
      5. 9.1.5. Stratasys Ltd. Market Share
      6. 9.1.6. Recent Initiatives, Funding/VC Activities, and Technological Innovations
    2. 9.2. 3D Systems Corporation
      1. 9.2.1. Company Overview
      2. 9.2.2. Product/Service Portfolio
      3. 9.2.3. 3D Systems Corporation Sales, Revenue, Price, and Gross Margin
      4. 9.2.4. 3D Systems Corporation Revenue and Growth Rate
      5. 9.2.5. 3D Systems Corporation Market Share
      6. 9.2.6. Recent Initiatives, Funding/VC Activities, and Technological Innovations
    3. 9.3. Materialise NV
      1. 9.3.1. Company Overview
      2. 9.3.2. Product/Service Portfolio
      3. 9.3.3. Materialise NV Sales, Revenue, Price, and Gross Margin
      4. 9.3.4. Materialise NV Revenue and Growth Rate
      5. 9.3.5. Materialise NV Market Share
      6. 9.3.6. Recent Initiatives, Funding/VC Activities, and Technological Innovations
    4. 9.4. Concept Laser GmbH
      1. 9.4.1. Company Overview
      2. 9.4.2. Product/Service Portfolio
      3. 9.4.3. Concept Laser GmbH Sales, Revenue, Price, and Gross Margin
      4. 9.4.4. Concept Laser GmbH Revenue and Growth Rate
      5. 9.4.5. Concept Laser GmbH Market Share
      6. 9.4.6. Recent Initiatives, Funding/VC Activities, and Technological Innovations
    5. 9.5. Arcam AB
      1. 9.5.1. Company Overview
      2. 9.5.2. Product/Service Portfolio
      3. 9.5.3. Arcam AB Sales, Revenue, Price, and Gross Margin
      4. 9.5.4. Arcam AB Revenue and Growth Rate
      5. 9.5.5. Arcam AB Market Share
      6. 9.5.6. Recent Initiatives, Funding/VC Activities, and Technological Innovations
    6. 9.6. Biomedical Modelling Inc.
      1. 9.6.1. Company Overview
      2. 9.6.2. Product/Service Portfolio
      3. 9.6.3. Biomedical Modelling Inc. Sales, Revenue, Price, and Gross Margin
      4. 9.6.4. Biomedical Modelling Inc. Revenue and Growth Rate
      5. 9.6.5. Biomedical Modelling Inc. Market Share
      6. 9.6.6. Recent Initiatives, Funding/VC Activities, and Technological Innovations
    7. 9.7. Organovo Holdings Inc.
      1. 9.7.1. Company Overview
      2. 9.7.2. Product/Service Portfolio
      3. 9.7.3. Organovo Holdings Inc. Sales, Revenue, Price, and Gross Margin
      4. 9.7.4. Organovo Holdings Inc. Revenue and Growth Rate
      5. 9.7.5. Organovo Holdings Inc. Market Share
      6. 9.7.6. Recent Initiatives, Funding/VC Activities, and Technological Innovations
    8. 9.8. Renishaw Plc.
      1. 9.8.1. Company Overview
      2. 9.8.2. Product/Service Portfolio
      3. 9.8.3. Renishaw Plc. Sales, Revenue, Price, and Gross Margin
      4. 9.8.4. Renishaw Plc. Revenue and Growth Rate
      5. 9.8.5. Renishaw Plc. Market Share
      6. 9.8.6. Recent Initiatives, Funding/VC Activities, and Technological Innovations
    9. 9.9. 3T RPD Ltd.
      1. 9.9.1. Company Overview
      2. 9.9.2. Product/Service Portfolio
      3. 9.9.3. 3T RPD Ltd. Sales, Revenue, Price, and Gross Margin
      4. 9.9.4. 3T RPD Ltd. Revenue and Growth Rate
      5. 9.9.5. 3T RPD Ltd. Market Share
      6. 9.9.6. Recent Initiatives, Funding/VC Activities, and Technological Innovations
    10. 9.10. Prodways Groups
      1. 9.10.1. Company Overview
      2. 9.10.2. Product/Service Portfolio
      3. 9.10.3. Prodways Groups Sales, Revenue, Price, and Gross Margin
      4. 9.10.4. Prodways Groups Revenue and Growth Rate
      5. 9.10.5. Prodways Groups Market Share
      6. 9.10.6. Recent Initiatives, Funding/VC Activities, and Technological Innovations
    11. 9.11. EOS GmbH Electro Optical Systems
      1. 9.11.1. Company Overview
      2. 9.11.2. Product/Service Portfolio
      3. 9.11.3. EOS GmbH Electro Optical Systems Sales, Revenue, Price, and Gross Margin
      4. 9.11.4. EOS GmbH Electro Optical Systems Revenue and Growth Rate
      5. 9.11.5. EOS GmbH Electro Optical Systems Market Share
      6. 9.11.6. Recent Initiatives, Funding/VC Activities, and Technological Innovations
    12. 9.12. Envisiontec GmbH
      1. 9.12.1. Company Overview
      2. 9.12.2. Product/Service Portfolio
      3. 9.12.3. Envisiontec GmbH Sales, Revenue, Price, and Gross Margin
      4. 9.12.4. Envisiontec GmbH Revenue and Growth Rate
      5. 9.12.5. Envisiontec GmbH Market Share
      6. 9.12.6. Recent Initiatives, Funding/VC Activities, and Technological Innovations
  10. Chapter 10 3D Printed Medical Devices — Industry Analysis
    1. 10.1. Introduction and Taxonomy
    2. 10.2. 3D Printed Medical Devices Market – Key Trends
      1. 10.2.1. Market Drivers
      2. 10.2.2. Market Restraints
      3. 10.2.3. Market Opportunities
    3. 10.3. Value Chain Analysis
    4. 10.4. Key Mandates and Regulations
    5. 10.5. Technology Roadmap and Timeline
    6. 10.6. 3D Printed Medical Devices Market – Attractiveness Analysis
      1. 10.6.1. By Component
      2. 10.6.2. By Type
      3. 10.6.3. By Technology
      4. 10.6.4. By End-Users
      5. 10.6.5. By Region
  11. Chapter 11 Raw Material Analysis
    1. 11.1. 3D Printed Medical Devices Key Raw Material Analysis
      1. 11.1.1. Key Raw Materials
      2. 11.1.2. Price Trend of Key Raw Materials
    2. 11.2. Key Suppliers of Raw Materials
    3. 11.3. Proportion of Manufacturing Cost Structure
      1. 11.3.1. Raw Materials Cost
      2. 11.3.2. Labor Cost
      3. 11.3.3. Manufacturing Expenses
      4. 11.3.4. Miscellaneous Expenses
    4. 11.4. Manufacturing Cost Analysis of 3D Printed Medical Devices
  12. Chapter 12 Industrial Chain, Sourcing Strategy, and Downstream Buyers
    1. 12.1. 3D Printed Medical Devices Industrial Chain Analysis
    2. 12.2. Upstream Raw Materials Sourcing
      1. 12.2.1. Risk Mitigation:
      2. 12.2.2. Supplier Relationships:
      3. 12.2.3. Business Processes:
      4. 12.2.4. Securing the Product:
    3. 12.3. Raw Materials Sources of 3D Printed Medical Devices Major Manufacturers
    4. 12.4. Downstream Buyers
    5. 12.5. Distributors/Traders List
  13. Chapter 13 Marketing Strategy Analysis, Distributors
    1. 13.1. Marketing Channel
    2. 13.2. Direct Marketing
    3. 13.3. Indirect Marketing
    4. 13.4. Marketing Channel Development Trends
    5. 13.5. Economic/Political Environmental Change
  14. Chapter 14 Report Conclusion & Key Insights
    1. 14.1. Key Insights from Primary Interviews & Surveys Respondents
    2. 14.2. Key Takeaways from Analysts, Consultants, and Industry Leaders
  15. Chapter 15 Research Approach & Methodology
    1. 15.1. Report Description
    2. 15.2. Research Scope
    3. 15.3. Research Methodology
      1. 15.3.1. Secondary Research
      2. 15.3.2. Primary Research
      3. 15.3.3. Statistical Models
        1. 15.3.3.1. Company Share Analysis Model
        2. 15.3.3.2. Revenue Based Modeling
      4. 15.3.4. Research Limitations

      List of Figures

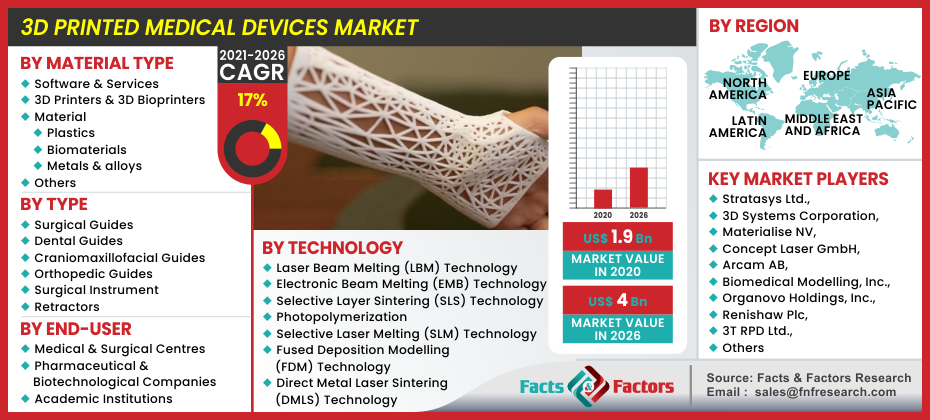
      Fig.1	Product Picture of 3D Printed Medical Devices
      Fig.2	Global 3D Printed Medical Devices Market, 2016 – 2026 (USD Billion)
      Fig.3	Global 3D Printed Medical Devices Market, 2016 – 2026 ()
      Fig.4	Global 3D Printed Medical Devices Market Absolute Revenue Opportunity, 2016 – 2026 (USD Billion)
      Fig.5	Global 3D Printed Medical Devices Market Incremental Revenue Opportunity, 2020 – 2026 (USD Billion)
      Fig.6	Global 3D Printed Medical Devices Market Share, by Component, 2020 & 2026 (USD Billion)
      Fig.7	Global 3D Printed Medical Devices Market Share, by Component, 2020 & 2026 ()
      Fig.8	Global Software & Services 3D Printed Medical Devices Market, 2016 – 2026 (USD Billion)
      Fig.9	Global Software & Services 3D Printed Medical Devices Market, 2016 – 2026 ()
      Fig.10	Global 3D Printers & 3D Bioprinters 3D Printed Medical Devices Market, 2016 – 2026 (USD Billion)
      Fig.11	Global 3D Printers & 3D Bioprinters 3D Printed Medical Devices Market, 2016 – 2026 ()
      Fig.12	Global Material 3D Printed Medical Devices Market, 2016 – 2026 (USD Billion)
      Fig.13	Global Material 3D Printed Medical Devices Market, 2016 – 2026 ()
      Fig.14	Global Others 3D Printed Medical Devices Market, 2016 – 2026 (USD Billion)
      Fig.15	Global Others 3D Printed Medical Devices Market, 2016 – 2026 ()
      Fig.16	Global 3D Printed Medical Devices Market Share, by Type, 2020 & 2026 (USD Billion)
      Fig.17	Global 3D Printed Medical Devices Market Share, by Type, 2020 & 2026 ()
      Fig.18	Global Surgical Guides 3D Printed Medical Devices Market, 2016 – 2026 (USD Billion)
      Fig.19	Global Surgical Guides 3D Printed Medical Devices Market, 2016 – 2026 ()
      Fig.20	Global Dental Guides 3D Printed Medical Devices Market, 2016 – 2026 (USD Billion)
      Fig.21	Global Dental Guides 3D Printed Medical Devices Market, 2016 – 2026 ()
      Fig.22	Global Craniomaxillofacial Guides 3D Printed Medical Devices Market, 2016 – 2026 (USD Billion)
      Fig.23	Global Craniomaxillofacial Guides 3D Printed Medical Devices Market, 2016 – 2026 ()
      Fig.24	Global Orthopedic Guides 3D Printed Medical Devices Market, 2016 – 2026 (USD Billion)
      Fig.25	Global Orthopedic Guides 3D Printed Medical Devices Market, 2016 – 2026 ()
      Fig.26	Global Surgical Instrument 3D Printed Medical Devices Market, 2016 – 2026 (USD Billion)
      Fig.27	Global Surgical Instrument 3D Printed Medical Devices Market, 2016 – 2026 ()
      Fig.28	Global Retractors 3D Printed Medical Devices Market, 2016 – 2026 (USD Billion)
      Fig.29	Global Retractors 3D Printed Medical Devices Market, 2016 – 2026 ()
      Fig.30	Global 3D Printed Medical Devices Market Share, by Technology, 2020 & 2026 (USD Billion)
      Fig.31	Global 3D Printed Medical Devices Market Share, by Technology, 2020 & 2026 ()
      Fig.32	Global Laser Beam Melting (LBM) Technology 3D Printed Medical Devices Market, 2016 – 2026 (USD Billion)
      Fig.33	Global Laser Beam Melting (LBM) Technology 3D Printed Medical Devices Market, 2016 – 2026 ()
      Fig.34	Global Electronic Beam Melting (EMB) Technology 3D Printed Medical Devices Market, 2016 – 2026 (USD Billion)
      Fig.35	Global Electronic Beam Melting (EMB) Technology 3D Printed Medical Devices Market, 2016 – 2026 ()
      Fig.36	Global Selective Layer Sintering (SLS) Technology 3D Printed Medical Devices Market, 2016 – 2026 (USD Billion)
      Fig.37	Global Selective Layer Sintering (SLS) Technology 3D Printed Medical Devices Market, 2016 – 2026 ()
      Fig.38	Global Photopolymerization 3D Printed Medical Devices Market, 2016 – 2026 (USD Billion)
      Fig.39	Global Photopolymerization 3D Printed Medical Devices Market, 2016 – 2026 ()
      Fig.40	Global Selective Laser Melting (SLM) Technology 3D Printed Medical Devices Market, 2016 – 2026 (USD Billion)
      Fig.41	Global Selective Laser Melting (SLM) Technology 3D Printed Medical Devices Market, 2016 – 2026 ()
      Fig.42	Global Fused Deposition Modelling (FDM) Technology 3D Printed Medical Devices Market, 2016 – 2026 (USD Billion)
      Fig.43	Global Fused Deposition Modelling (FDM) Technology 3D Printed Medical Devices Market, 2016 – 2026 ()
      Fig.44	Global Direct Metal Laser Sintering (DMLS) Technology 3D Printed Medical Devices Market, 2016 – 2026 (USD Billion)
      Fig.45	Global Direct Metal Laser Sintering (DMLS) Technology 3D Printed Medical Devices Market, 2016 – 2026 ()
      Fig.46	Global 3D Printed Medical Devices Market Share, by End-Users, 2020 & 2026 (USD Billion)
      Fig.47	Global 3D Printed Medical Devices Market Share, by End-Users, 2020 & 2026 ()
      Fig.48	Global Medical & Surgical Centers 3D Printed Medical Devices Market, 2016 – 2026 (USD Billion)
      Fig.49	Global Medical & Surgical Centers 3D Printed Medical Devices Market, 2016 – 2026 ()
      Fig.50	Global Pharmaceutical and Biotechnological Companies 3D Printed Medical Devices Market, 2016 – 2026 (USD Billion)
      Fig.51	Global Pharmaceutical and Biotechnological Companies 3D Printed Medical Devices Market, 2016 – 2026 ()
      Fig.52	Global Academic Institutions 3D Printed Medical Devices Market, 2016 – 2026 (USD Billion)
      Fig.53	Global Academic Institutions 3D Printed Medical Devices Market, 2016 – 2026 ()
      Fig.54	Global 3D Printed Medical Devices Market Share, by Region, 2020 & 2026 (USD Billion)
      Fig.55	Global 3D Printed Medical Devices Market Share, by Region, 2020 & 2026 ()
      Fig.56	North America 3D Printed Medical Devices Market, 2016 – 2026 (USD Billion)
      Fig.57	North America 3D Printed Medical Devices Market, 2016 – 2026 ()
      Fig.58	U.S. 3D Printed Medical Devices Market, 2016 – 2026 (USD Billion)
      Fig.59	U.S. 3D Printed Medical Devices  Market, 2016 – 2026 ()
      Fig.60	Canada 3D Printed Medical Devices Market, 2016 – 2026 (USD Billion)
      Fig.61	Canada 3D Printed Medical Devices  Market, 2016 – 2026 ()
      Fig.62	Europe 3D Printed Medical Devices Market, 2016 – 2026 (USD Billion)
      Fig.63	Europe 3D Printed Medical Devices Market, 2016 – 2026 ()
      Fig.64	Germany 3D Printed Medical Devices Market, 2016 – 2026 (USD Billion)
      Fig.65	Germany 3D Printed Medical Devices  Market, 2016 – 2026 ()
      Fig.66	France 3D Printed Medical Devices Market, 2016 – 2026 (USD Billion)
      Fig.67	France 3D Printed Medical Devices  Market, 2016 – 2026 ()
      Fig.68	U.K. 3D Printed Medical Devices Market, 2016 – 2026 (USD Billion)
      Fig.69	U.K. 3D Printed Medical Devices  Market, 2016 – 2026 ()
      Fig.70	Italy 3D Printed Medical Devices Market, 2016 – 2026 (USD Billion)
      Fig.71	Italy 3D Printed Medical Devices  Market, 2016 – 2026 ()
      Fig.72	Spain 3D Printed Medical Devices Market, 2016 – 2026 (USD Billion)
      Fig.73	Spain 3D Printed Medical Devices  Market, 2016 – 2026 ()
      Fig.74	Rest of Europe 3D Printed Medical Devices Market, 2016 – 2026 (USD Billion)
      Fig.75	Rest of Europe 3D Printed Medical Devices  Market, 2016 – 2026 ()
      Fig.76	Asia Pacific 3D Printed Medical Devices Market, 2016 – 2026 (USD Billion)
      Fig.77	Asia Pacific 3D Printed Medical Devices Market, 2016 – 2026 ()
      Fig.78	China 3D Printed Medical Devices Market, 2016 – 2026 (USD Billion)
      Fig.79	China 3D Printed Medical Devices  Market, 2016 – 2026 ()
      Fig.80	Japan 3D Printed Medical Devices Market, 2016 – 2026 (USD Billion)
      Fig.81	Japan 3D Printed Medical Devices  Market, 2016 – 2026 ()
      Fig.82	India 3D Printed Medical Devices Market, 2016 – 2026 (USD Billion)
      Fig.83	India 3D Printed Medical Devices  Market, 2016 – 2026 ()
      Fig.84	South  Korea 3D Printed Medical Devices Market, 2016 – 2026 (USD Billion)
      Fig.85	South  Korea 3D Printed Medical Devices  Market, 2016 – 2026 ()
      Fig.86	South-East Asia 3D Printed Medical Devices Market, 2016 – 2026 (USD Billion)
      Fig.87	South-East Asia 3D Printed Medical Devices  Market, 2016 – 2026 ()
      Fig.88	Rest of Asia Pacific 3D Printed Medical Devices Market, 2016 – 2026 (USD Billion)
      Fig.89	Rest of Asia Pacific 3D Printed Medical Devices  Market, 2016 – 2026 ()
      Fig.90	Latin America 3D Printed Medical Devices Market, 2016 – 2026 (USD Billion)
      Fig.91	Latin America 3D Printed Medical Devices Market, 2016 – 2026 ()
      Fig.92	Brazil 3D Printed Medical Devices Market, 2016 – 2026 (USD Billion)
      Fig.93	Brazil 3D Printed Medical Devices  Market, 2016 – 2026 ()
      Fig.94	Mexico 3D Printed Medical Devices Market, 2016 – 2026 (USD Billion)
      Fig.95	Mexico 3D Printed Medical Devices  Market, 2016 – 2026 ()
      Fig.96	Rest of Latin America 3D Printed Medical Devices Market, 2016 – 2026 (USD Billion)
      Fig.97	Rest of Latin America 3D Printed Medical Devices  Market, 2016 – 2026 ()
      Fig.98	The Middle-East and Africa 3D Printed Medical Devices Market, 2016 – 2026 (USD Billion)
      Fig.99	The Middle-East and Africa 3D Printed Medical Devices Market, 2016 – 2026 ()
      Fig.100	GCC Countries 3D Printed Medical Devices Market, 2016 – 2026 (USD Billion)
      Fig.101	GCC Countries 3D Printed Medical Devices  Market, 2016 – 2026 ()
      Fig.102	South Africa 3D Printed Medical Devices Market, 2016 – 2026 (USD Billion)
      Fig.103	South Africa 3D Printed Medical Devices  Market, 2016 – 2026 ()
      Fig.104	Rest of Middle-East Africa 3D Printed Medical Devices Market, 2016 – 2026 (USD Billion)
      Fig.105	Rest of Middle-East Africa 3D Printed Medical Devices  Market, 2016 – 2026 ()
      Fig.106	Global 3D Printed Medical Devices Production and Consumption, 2016 – 2026 ()
      Fig.107	North America 3D Printed Medical Devices Production and Consumption, 2016 – 2026 (USD Billion) ()
      Fig.108	Europe 3D Printed Medical Devices Production and Consumption, 2016 – 2026 (USD Billion) ()
      Fig.109	Asia Pacific 3D Printed Medical Devices Production and Consumption, 2016 – 2026 (USD Billion) ()
      Fig.110	Latin America 3D Printed Medical Devices Production and Consumption, 2016 – 2026 (USD Billion) ()
      Fig.111	The Middle-East and Africa 3D Printed Medical Devices Production and Consumption, 2016 – 2026 (USD Billion) ()
      Fig.112	Competitor Market Share – Revenue
      Fig.113	Competitor Market Share – Volume
      Fig.114	Stratasys Ltd. Revenue and Growth Rate
      Fig.115	Stratasys Ltd. Market Share
      Fig.116	3D Systems Corporation Revenue and Growth Rate
      Fig.117	3D Systems Corporation Market Share
      Fig.118	Materialise NV Revenue and Growth Rate
      Fig.119	Materialise NV Market Share
      Fig.120	Concept Laser GmbH Revenue and Growth Rate
      Fig.121	Concept Laser GmbH Market Share
      Fig.122	Arcam AB Revenue and Growth Rate
      Fig.123	Arcam AB Market Share
      Fig.124	Biomedical Modelling Inc. Revenue and Growth Rate
      Fig.125	Biomedical Modelling Inc. Market Share
      Fig.126	Organovo Holdings Inc. Revenue and Growth Rate
      Fig.127	Organovo Holdings Inc. Market Share
      Fig.128	Renishaw Plc. Revenue and Growth Rate
      Fig.129	Renishaw Plc. Market Share
      Fig.130	3T RPD Ltd. Revenue and Growth Rate
      Fig.131	3T RPD Ltd. Market Share
      Fig.132	Prodways Groups Revenue and Growth Rate
      Fig.133	Prodways Groups Market Share
      Fig.134	EOS GmbH Electro Optical Systems Revenue and Growth Rate
      Fig.135	EOS GmbH Electro Optical Systems Market Share
      Fig.136	Envisiontec GmbH Revenue and Growth Rate
      Fig.137	Envisiontec GmbH Market Share
      Fig.138	Market Dynamics
      Fig.139	Global 3D Printed Medical Devices – Value Chain Analysis
      Fig.140	Key Mandates and Regulations
      Fig.141	Technology Roadmap and Timeline
      Fig.142	Market Attractiveness Analysis – By Component
      Fig.143	Market Attractiveness Analysis – By Type
      Fig.144	Market Attractiveness Analysis – By Technology
      Fig.145	Market Attractiveness Analysis – By End-Users
      Fig.146	Market Attractiveness Analysis – By Region
      Fig.147	Manufacturing Cost Structure of 3D Printed Medical Devices
      Fig.148	3D Printed Medical Devices Industrial Chain Analysis
      Fig.149	Market Channels
      Fig.150	Marketing Channel Development Trend
      Fig.151	Growth in World Gross Product, 2008-2018
      

      List of Tables

      Table 1	Global 3D Printed Medical Devices Market, 2020 & 2026 (USD Billion)
      Table 2	Global 3D Printed Medical Devices Market, by Component, 2016 – 2026 (USD Billion)
      Table 3	Global 3D Printed Medical Devices Market, by Component, 2016 – 2026 ()
      Table 4	Global 3D Printed Medical Devices Market, by Type, 2016 – 2026 (USD Billion)
      Table 5	Global 3D Printed Medical Devices Market, by Type, 2016 – 2026 ()
      Table 6	Global 3D Printed Medical Devices Market, by Technology, 2016 – 2026 (USD Billion)
      Table 7	Global 3D Printed Medical Devices Market, by Technology, 2016 – 2026 ()
      Table 8	Global 3D Printed Medical Devices Market, by End-Users, 2016 – 2026 (USD Billion)
      Table 9 Global 3D Printed Medical Devices Market, by End-Users, 2016 – 2026 ()
      Table 10 Global 3D Printed Medical Devices Market, by Region, 2016 – 2026 (USD Billion)
      Table 11 Global 3D Printed Medical Devices Market, by Region, 2016 – 2026 ()
      Table 12 North America 3D Printed Medical Devices Market, by Country, 2016 – 2026 (USD Billion)
      Table 13 North America 3D Printed Medical Devices Market, by Country, 2016 – 2026 ()
      Table 14 North America 3D Printed Medical Devices Market, by Component, 2016 – 2026 (USD Billion)
      Table 15 North America 3D Printed Medical Devices Market, by Component, 2016 – 2026 ()
      Table 16 North America 3D Printed Medical Devices Market, by Type, 2016 – 2026 (USD Billion)
      Table 17 North America 3D Printed Medical Devices Market, by Type, 2016 – 2026 ()
      Table 18 North America 3D Printed Medical Devices Market, by Technology, 2016 – 2026 (USD Billion)
      Table 19 North America 3D Printed Medical Devices Market, by Technology, 2016 – 2026 ()
      Table 20 North America 3D Printed Medical Devices Market, by End-Users, 2016 – 2026 (USD Billion)
      Table 21 North America 3D Printed Medical Devices Market, by End-Users, 2016 – 2026 ()
      Table 22 Europe 3D Printed Medical Devices Market, by Country, 2016 – 2026 (USD Billion)
      Table 23 Europe 3D Printed Medical Devices Market, by Country, 2016 – 2026 ()
      Table 24 Europe 3D Printed Medical Devices Market, by Component, 2016 – 2026 (USD Billion)
      Table 25 Europe 3D Printed Medical Devices Market, by Component, 2016 – 2026 ()
      Table 26 Europe 3D Printed Medical Devices Market, by Type, 2016 – 2026 (USD Billion)
      Table 27 Europe 3D Printed Medical Devices Market, by Type, 2016 – 2026 ()
      Table 28 Europe 3D Printed Medical Devices Market, by Technology, 2016 – 2026 (USD Billion)
      Table 29 Europe 3D Printed Medical Devices Market, by Technology, 2016 – 2026 ()
      Table 30 Europe 3D Printed Medical Devices Market, by End-Users, 2016 – 2026 (USD Billion)
      Table 31 Europe 3D Printed Medical Devices Market, by End-Users, 2016 – 2026 ()
      Table 32 Asia Pacific 3D Printed Medical Devices Market, by Country, 2016 – 2026 (USD Billion)
      Table 33 Asia Pacific 3D Printed Medical Devices Market, by Country, 2016 – 2026 ()
      Table 34 Asia Pacific 3D Printed Medical Devices Market, by Component, 2016 – 2026 (USD Billion)
      Table 35 Asia Pacific 3D Printed Medical Devices Market, by Component, 2016 – 2026 ()
      Table 36 Asia Pacific 3D Printed Medical Devices Market, by Type, 2016 – 2026 (USD Billion)
      Table 37 Asia Pacific 3D Printed Medical Devices Market, by Type, 2016 – 2026 ()
      Table 38 Asia Pacific 3D Printed Medical Devices Market, by Technology, 2016 – 2026 (USD Billion)
      Table 39 Asia Pacific 3D Printed Medical Devices Market, by Technology, 2016 – 2026 ()
      Table 40 Asia Pacific 3D Printed Medical Devices Market, by End-Users, 2016 – 2026 (USD Billion)
      Table 41 Asia Pacific 3D Printed Medical Devices Market, by End-Users, 2016 – 2026 ()
      Table 42 Latin America 3D Printed Medical Devices Market, by Country, 2016 – 2026 (USD Billion)
      Table 43 Latin America 3D Printed Medical Devices Market, by Country, 2016 – 2026 ()
      Table 44 Latin America 3D Printed Medical Devices Market, by Component, 2016 – 2026 (USD Billion)
      Table 45 Latin America 3D Printed Medical Devices Market, by Component, 2016 – 2026 ()
      Table 46 Latin America 3D Printed Medical Devices Market, by Type, 2016 – 2026 (USD Billion)
      Table 47 Latin America 3D Printed Medical Devices Market, by Type, 2016 – 2026 ()
      Table 48 Latin America 3D Printed Medical Devices Market, by Technology, 2016 – 2026 (USD Billion)
      Table 49 Latin America 3D Printed Medical Devices Market, by Technology, 2016 – 2026 ()
      Table 50 Latin America 3D Printed Medical Devices Market, by End-Users, 2016 – 2026 (USD Billion)
      Table 51 Latin America 3D Printed Medical Devices Market, by End-Users, 2016 – 2026 ()
      Table 52 The Middle-East and Africa 3D Printed Medical Devices Market, by Country, 2016 – 2026 (USD Billion)
      Table 53 The Middle-East and Africa 3D Printed Medical Devices Market, by Country, 2016 – 2026 ()
      Table 54 The Middle-East and Africa 3D Printed Medical Devices Market, by Component, 2016 – 2026 (USD Billion)
      Table 55 The Middle-East and Africa 3D Printed Medical Devices Market, by Component, 2016 – 2026 ()
      Table 56 The Middle-East and Africa 3D Printed Medical Devices Market, by Type, 2016 – 2026 (USD Billion)
      Table 57 The Middle-East and Africa 3D Printed Medical Devices Market, by Type, 2016 – 2026 ()
      Table 58 The Middle-East and Africa 3D Printed Medical Devices Market, by Technology, 2016 – 2026 (USD Billion)
      Table 59 The Middle-East and Africa 3D Printed Medical Devices Market, by Technology, 2016 – 2026 ()
      Table 60 The Middle-East and Africa 3D Printed Medical Devices Market, by End-Users, 2016 – 2026 (USD Billion)
      Table 61 The Middle-East and Africa 3D Printed Medical Devices Market, by End-Users, 2016 – 2026 ()
      Table 62 North America 3D Printed Medical Devices Production, Consumption, Export, Import, 2021 – 2019
      Table 63 Europe 3D Printed Medical Devices Production, Consumption, Export, Import, 2021 – 2019
      Table 64 Asia Pacific 3D Printed Medical Devices Production, Consumption, Export, Import, 2021 – 2019
      Table 65 Latin America 3D Printed Medical Devices Production, Consumption, Export, Import, 2021 – 2019
      Table 66 The Middle-East and Africa 3D Printed Medical Devices Production, Consumption, Export, Import, 2021 – 2019
      Table 67 Global 3D Printed Medical Devices Market - Company Revenue Analysis, 2016 – 2019 (USD Billion)
      Table 68 Global 3D Printed Medical Devices Market - Company Revenue Share Analysis, 2016 – 2019 (%)
      Table 69 Global 3D Printed Medical Devices Market - Company Volume Analysis, 2021 – 2019 ()
      Table 70 Global 3D Printed Medical Devices Market - Company Volume Share Analysis, 2021 – 2019 (%)
      Table 71 Acquisitions and Mergers
      Table 72 Market Drivers – Impact Analysis
      Table 73 Market Restraints
      Table 74 Market Opportunities
      Table 75 Production Base and Market Concentration Rate of Raw Material
      Table 76 Key Suppliers of Raw Materials
      Table 77 Raw Materials Sources of 3D Printed Medical Devices Major Manufacturers
      Table 78 Major Buyers of 3D Printed Medical Devices
      Table 79 Distributors/Traders of 3D Printed Medical Devices by Region
      

Industry Major Market Players

  • Stratasys Ltd.
  • 3D Systems Corporation
  • Materialise NV
  • Concept Laser GmbH
  • Arcam AB
  • Biomedical Modelling Inc.
  • Organovo Holdings Inc.
  • Renishaw Plc
  • 3T RPD Ltd.
  • Prodways Groups
  • EOS GmbH Electro Optical Systems
  • Envisiontec GmbH