Search Market Research Report

Discover Our Latest Reports
Discover Our Featured Reports
Discover Top Selling Reports

3D Printed Jewelry Market Size, Share Global Analysis Report, 2020–2026

report img

3D Printed Jewelry Market By Jewelry Type (Gold, Silver, Brass, Bronze, and Others), By Technology (Stereolithography (SLA), Fused depositing modelling (FDM), Selective laser sintering (SLS), Digital light processing (DLP), and Others): Global Industry Outlook, Market Size, Business Intelligence, Consumer Preferences, Statistical Surveys, Comprehensive Analysis, Historical Developments, Current Trends, and Forecast 2020–2026

Industry Insights

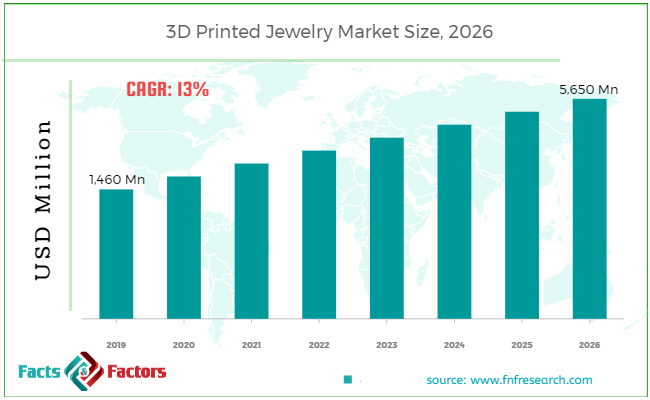
[175+ Pages Report] According to the report published by Facts Factors, the global 3D printed jewelry market size was worth around USD 1,460 million in 2019 and is predicted to grow to around USD 5,650 million by 2026 with a compound annual growth rate (CAGR) of roughly 13% between 2020 and 2026. The report analyzes the global 3D printed jewelry market drivers, restraints/challenges, and the effect they have on the demands during the projection period. In addition, the report explores emerging opportunities in the 3D printed jewelry market.

3D Printed Jewelry Market Size

To know more about this report | Request Free Sample Copy

This specialized and expertise-oriented industry research report scrutinizes the technical and commercial business outlook of the 3D printed jewelry industry. The report analyzes and declares the historical and current trends analysis of the 3D printed jewelry industry and subsequently recommends the projected trends anticipated to be observed in the 3D printed jewelry market during the upcoming years.


logoKey Insights from Primary Research

  • The rapid adoption of 3D printing technologies by jewelers for creating high surface quality and jewellery that have high quality for intricate jewelry geometries has been one of the key growths driving factor for the global 3D printed jewelry market.
  • The global jewellery industry has also seen significant growth in recent years owing to the increase in the disposable income of middle class. This has driven the rapid demand for jewelleries, which, in turn, has been driving the 3D printed jewellery market.
  • Based on jewellery types, the gold segment dominated the global 3D printed jewellery market in 2019, due to the increasing demand for gold jewelleries around the world.
  • Depending upon technology, the selective laser sintering (SLS) segment dominated the global market in 2019, accounting for a market share of 35% in 2019.

logoKey Recommendations from Analysts

  • According to our analysts, the global 3D printed jewellery market is expected to reach to a market value of approximately USD 5.7 billion by 2026, growing at a CAGR of nearly 13% over the period 2020-2026.
  • Based on the region, the North America region held the majority of the share of the global 3D printed jewellery market in 2019 and is expected to maintain the dominance over the forecasted period.
  • Asia Pacific region is expected to record the highest growth rate over the period of 2020-2026, mainly due to the rapid increase in the demand for gems and jewelleries in India, China, and Japan.
  • Use of 3D printers by jewellers for manufacturing customized jewellery is expected to create avenues for the global 3D printed jewellery market in the future.

The 3D printed jewelry market report analyzes and notifies the industry statistics at the global as well as regional and country levels in order to acquire a thorough perspective of the entire 3D printed jewelry market. The historical and past insights are provided for FY 2016 to FY 2019 whereas projected trends are delivered for FY 2020 to FY 2026. The quantitative and numerical data is represented in terms of value (USD Million) from FY 2016 – to 2026.

The quantitative data is further underlined and reinforced by comprehensive qualitative data which comprises various across-the-board market dynamics. The rationales which directly or indirectly impact the 3D printed jewelry industry are exemplified through parameters such as growth drivers, restraints, challenges, and opportunities among other impacting factors.

Throughout our research report, we have encompassed all the proven models and tools of industry analysis and extensively illustrated all the key business strategies and business models adopted in the 3D printed jewelry industry. The report provides an all-inclusive and detailed competitive landscape prevalent in the 3D printed jewelry market.

The report utilizes established industry analysis tools and models such as Porter’s Five Forces framework to analyze and recognize critical business strategies adopted by various stakeholders involved in the entire value chain of the 3D printed jewelry industry. The 3D printed jewelry market report additionally employs SWOT analysis and PESTLE analysis models for further in-depth analysis.

The report study further includes an in-depth analysis of industry players' market shares and provides an overview of leading players' market position in the 3D printed jewelry sector. Key strategic developments in the 3D printed jewelry market competitive landscape such as acquisitions & mergers, inaugurations of different products and services, partnerships & joint ventures, MoU agreements, VC & funding activities, R&D activities, and geographic expansion among other noteworthy activities by key players of the 3D printed jewelry market are appropriately highlighted in the report.

The 3D printed jewelry industry has been mainly driven by the increasing use of the 3D printing process for producing smooth surfaces as well as high-quality jewelry. Jewelers also use 3D printing as well as Computer-Aided Design (CAD) for producing customized jewelry. Such trends have been driving the global 3D printed jewelry market.

The 3D printed jewelry market research report delivers an acute valuation and taxonomy of the 3D printed jewelry industry by practically splitting the market on the basis of different types, applications, industry verticals, and regions. Through the analysis of the historical and projected trends, all the segments and sub-segments were evaluated through the bottom-up approach, and different market sizes have been projected for FY 2020 to FY 2026.

logoReport Scope

Report Attribute

Details

Market Size in 2019

USD 1,460 Million

Projected Market Size in 2026

USD 5,650 Million

CAGR Growth Rate

13% CAGR

Base Year

2019

Forecast Years

2020-2026

Key Market Players

Mizaroh, Precious Upload & Print, GUY & MAX, Nervous System, RADIAN, Diana Law, Isharya, American Pearl, Anna, Pipa + Belle, Melorra, and Others

Key Segment

By Jewelry, Application , and Region

Major Regions Covered

North America, Europe, Asia Pacific, Latin America, and the Middle East & Africa

Purchase Options

Request customized purchase options to meet your research needs.Explore purchase options

The regional segmentation of the 3D printed jewelry industry includes the complete classification of all the major continents including North America, Latin America, Europe, Asia Pacific, and the Middle East & Africa. Further, country-wise data for the 3D printed jewelry industry is provided for the leading economies of the world.

The 3D printed jewelry market is segmented based on type, application, and region. On the basis of type segmentation, the market is classified into gold, silver, brass, bronze, and others. In terms of application segmentation, the market is bifurcated into stereolithography (SLA), fused depositing modeling (FDM), selective laser sintering (SLS), digital light processing (DLP), and others.

logoSome of the essential players operating in the 3D printed jewelry market, but not restricted to include

  • Mizaroh
  • Precious Upload & Print
  • GUY & MAX
  • Nervous System
  • RADIAN
  • Diana Law
  • Isharya
  • American Pearl
  • Anna
  • Pipa + Belle
  • Melorra
  • among others.

The taxonomy of the 3D printed jewelry Market by its scope and segmentation is as follows:

logoBy Jewelry Type Analysis

  • Gold
  • Silver
  • Brass
  • Bronze
  • Others

logoBy Application Analysis

  • Stereolithography (SLA)
  • Fused depositing modelling (FDM)
  • Selective laser sintering (SLS)
  • Digital light processing (DLP)
  • Others

logoBy Regional Segmentation Analysis

  • North America
    • The U.S.
    • Canada
  • Europe
    • Germany
    • The UK
    • France
    • Spain
    • Italy
    • Rest of Europe
  • Asia Pacific
    • China
    • Japan
    • India
    • South Korea
    • Southeast Asia
    • Rest of Asia Pacific
  • Latin America
    • Brazil
    • Mexico
    • Rest of Latin America
  • Middle East & Africa
    • GCC
    • South Africa
    • Rest of the Middle East & Africa

Table of Content

  1. Chapter 1 Executive Summary
    1. 1.1. Introduction of 3D Printed Jewelry
    2. 1.2. Global 3D Printed Jewelry Market, 2019 & 2026 (USD Million)
    3. 1.3. Global 3D Printed Jewelry Market, 2016 – 2026 (USD Million)
    4. 1.4. Global 3D Printed Jewelry Market Absolute Revenue Opportunity, 2016 – 2026 (USD Million)
    5. 1.5. Global 3D Printed Jewelry Market Incremental Revenue Opportunity, 2020 – 2026 (USD Million)
  2. Chapter 2 3D Printed Jewelry Market – Jewelry Type Analysis
    1. 2.1. Global 3D Printed Jewelry Market – Jewelry Type Overview
    2. 2.2. Global 3D Printed Jewelry Market Share, by Jewelry Type, 2019 & 2026 (USD Million)
    3. 2.3. Gold
      1. 2.3.1. Global Gold 3D Printed Jewelry Market, 2016 – 2026 (USD Million)
    4. 2.4. Silver
      1. 2.4.1. Global Silver 3D Printed Jewelry Market, 2016 – 2026 (USD Million)
    5. 2.5. Brass
      1. 2.5.1. Global Brass 3D Printed Jewelry Market, 2016 – 2026 (USD Million)
    6. 2.6. Bronze
      1. 2.6.1. Global Bronze 3D Printed Jewelry Market, 2016 – 2026 (USD Million)
    7. 2.7. Others
      1. 2.7.1. Global Others 3D Printed Jewelry Market, 2016 – 2026 (USD Million)
  3. Chapter 3 3D Printed Jewelry Market – Technology Analysis
    1. 3.1. Global 3D Printed Jewelry Market – Technology Overview
    2. 3.2. Global 3D Printed Jewelry Market Share, by Technology, 2019 & 2026 (USD Million)
    3. 3.3. Stereolithography (SLA)
      1. 3.3.1. Global Stereolithography (SLA) 3D Printed Jewelry Market, 2016 – 2026 (USD Million)
    4. 3.4. Fused depositing modelling (FDM)
      1. 3.4.1. Global Fused depositing modelling (FDM) 3D Printed Jewelry Market, 2016 – 2026 (USD Million)
    5. 3.5. Selective laser sintering (SLS)
      1. 3.5.1. Global Selective laser sintering (SLS) 3D Printed Jewelry Market, 2016 – 2026 (USD Million)
    6. 3.6. Digital light processing (DLP)
      1. 3.6.1. Global Digital light processing (DLP) 3D Printed Jewelry Market, 2016 – 2026 (USD Million)
    7. 3.7. Others
      1. 3.7.1. Global Others 3D Printed Jewelry Market, 2016 – 2026 (USD Million)
  4. Chapter 4 3D Printed Jewelry Market – Regional Analysis
    1. 4.1. Global 3D Printed Jewelry Market Regional Overview
    2. 4.2. Global 3D Printed Jewelry Market Share, by Region, 2019 & 2026 (USD Million)
    3. 4.3. North America
      1. 4.3.1. North America 3D Printed Jewelry Market, 2016 – 2026 (USD Million)
        1. 4.3.1.1. North America 3D Printed Jewelry Market, by Country, 2016 - 2026 (USD Million)
      2. 4.3.2. North America 3D Printed Jewelry Market, by Jewelry Type, 2016 – 2026
        1. 4.3.2.1. North America 3D Printed Jewelry Market, by Jewelry Type, 2016 – 2026 (USD Million)
      3. 4.3.3. North America 3D Printed Jewelry Market, by Technology, 2016 – 2026
        1. 4.3.3.1. North America 3D Printed Jewelry Market, by Technology, 2016 – 2026 (USD Million)
      4. 4.3.4. U.S.
        1. 4.3.4.1. U.S. 3D Printed Jewelry Market, 2016 – 2026 (USD Million)
      5. 4.3.5. Canada
        1. 4.3.5.1. Canada 3D Printed Jewelry Market, 2016 – 2026 (USD Million)
    4. 4.4. Europe
      1. 4.4.1. Europe 3D Printed Jewelry Market, 2016 – 2026 (USD Million)
        1. 4.4.1.1. Europe 3D Printed Jewelry Market, by Country, 2016 - 2026 (USD Million)
      2. 4.4.2. Europe 3D Printed Jewelry Market, by Jewelry Type, 2016 – 2026
        1. 4.4.2.1. Europe 3D Printed Jewelry Market, by Jewelry Type, 2016 – 2026 (USD Million)
      3. 4.4.3. Europe 3D Printed Jewelry Market, by Technology, 2016 – 2026
        1. 4.4.3.1. Europe 3D Printed Jewelry Market, by Technology, 2016 – 2026 (USD Million)
      4. 4.4.4. Germany
        1. 4.4.4.1. Germany 3D Printed Jewelry Market, 2016 – 2026 (USD Million)
      5. 4.4.5. France
        1. 4.4.5.1. France 3D Printed Jewelry Market, 2016 – 2026 (USD Million)
      6. 4.4.6. U.K.
        1. 4.4.6.1. U.K. 3D Printed Jewelry Market, 2016 – 2026 (USD Million)
      7. 4.4.7. Italy
        1. 4.4.7.1. Italy 3D Printed Jewelry Market, 2016 – 2026 (USD Million)
      8. 4.4.8. Spain
        1. 4.4.8.1. Spain 3D Printed Jewelry Market, 2016 – 2026 (USD Million)
      9. 4.4.9. Rest of Europe
        1. 4.4.9.1. Rest of Europe 3D Printed Jewelry Market, 2016 – 2026 (USD Million)
    5. 4.5. Asia Pacific
      1. 4.5.1. Asia Pacific 3D Printed Jewelry Market, 2016 – 2026 (USD Million)
        1. 4.5.1.1. Asia Pacific 3D Printed Jewelry Market, by Country, 2016 - 2026 (USD Million)
      2. 4.5.2. Asia Pacific 3D Printed Jewelry Market, by Jewelry Type, 2016 – 2026
        1. 4.5.2.1. Asia Pacific 3D Printed Jewelry Market, by Jewelry Type, 2016 – 2026 (USD Million)
      3. 4.5.3. Asia Pacific 3D Printed Jewelry Market, by Technology, 2016 – 2026
        1. 4.5.3.1. Asia Pacific 3D Printed Jewelry Market, by Technology, 2016 – 2026 (USD Million)
      4. 4.5.4. China
        1. 4.5.4.1. China 3D Printed Jewelry Market, 2016 – 2026 (USD Million)
      5. 4.5.5. Japan
        1. 4.5.5.1. Japan 3D Printed Jewelry Market, 2016 – 2026 (USD Million)
      6. 4.5.6. India
        1. 4.5.6.1. India 3D Printed Jewelry Market, 2016 – 2026 (USD Million)
      7. 4.5.7. South Korea
        1. 4.5.7.1. South Korea 3D Printed Jewelry Market, 2016 – 2026 (USD Million)
      8. 4.5.8. South-East Asia
        1. 4.5.8.1. South-East Asia 3D Printed Jewelry Market, 2016 – 2026 (USD Million)
      9. 4.5.9. Rest of Asia Pacific
        1. 4.5.9.1. Rest of Asia Pacific 3D Printed Jewelry Market, 2016 – 2026 (USD Million)
    6. 4.6. Latin America
      1. 4.6.1. Latin America 3D Printed Jewelry Market, 2016 – 2026 (USD Million)
        1. 4.6.1.1. Latin America 3D Printed Jewelry Market, by Country, 2016 - 2026 (USD Million)
      2. 4.6.2. Latin America 3D Printed Jewelry Market, by Jewelry Type, 2016 – 2026
        1. 4.6.2.1. Latin America 3D Printed Jewelry Market, by Jewelry Type, 2016 – 2026 (USD Million)
      3. 4.6.3. Latin America 3D Printed Jewelry Market, by Technology, 2016 – 2026
        1. 4.6.3.1. Latin America 3D Printed Jewelry Market, by Technology, 2016 – 2026 (USD Million)
      4. 4.6.4. Brazil
        1. 4.6.4.1. Brazil 3D Printed Jewelry Market, 2016 – 2026 (USD Million)
      5. 4.6.5. Mexico
        1. 4.6.5.1. Mexico 3D Printed Jewelry Market, 2016 – 2026 (USD Million)
      6. 4.6.6. Rest of Latin America
        1. 4.6.6.1. Rest of Latin America 3D Printed Jewelry Market, 2016 – 2026 (USD Million)
    7. 4.7. The Middle-East and Africa
      1. 4.7.1. The Middle-East and Africa 3D Printed Jewelry Market, 2016 – 2026 (USD Million)
        1. 4.7.1.1. The Middle-East and Africa 3D Printed Jewelry Market, by Country, 2016 - 2026 (USD Million)
      2. 4.7.2. The Middle-East and Africa 3D Printed Jewelry Market, by Jewelry Type, 2016 – 2026
        1. 4.7.2.1. The Middle-East and Africa 3D Printed Jewelry Market, by Jewelry Type, 2016 – 2026 (USD Million)
      3. 4.7.3. The Middle-East and Africa 3D Printed Jewelry Market, by Technology, 2016 – 2026
        1. 4.7.3.1. The Middle-East and Africa 3D Printed Jewelry Market, by Technology, 2016 – 2026 (USD Million)
      4. 4.7.4. GCC Countries
        1. 4.7.4.1. GCC Countries 3D Printed Jewelry Market, 2016 – 2026 (USD Million)
      5. 4.7.5. South Africa
        1. 4.7.5.1. South Africa 3D Printed Jewelry Market, 2016 – 2026 (USD Million)
      6. 4.7.6. Rest of Middle-East Africa
        1. 4.7.6.1. Rest of Middle-East Africa 3D Printed Jewelry Market, 2016 – 2026 (USD Million)
  5. Chapter 5 3D Printed Jewelry Market – Competitive Landscape
    1. 5.1. Competitor Market Share – Revenue
    2. 5.2. Market Concentration Rate Analysis, Top 3 and Top 5 Players
    3. 5.3. Strategic Developments
      1. 5.3.1. Acquisitions and Mergers
      2. 5.3.2. New Products
      3. 5.3.3. Research & Development Activities
  6. Chapter 6 Company Profiles
    1. 6.1. Mizaroh
      1. 6.1.1. Company Overview
      2. 6.1.2. Product/Service Portfolio
      3. 6.1.3. Mizaroh Sales, Revenue, and Gross Margin
      4. 6.1.4. Mizaroh Revenue and Growth Rate
      5. 6.1.5. Mizaroh Market Share
      6. 6.1.6. Recent Initiatives, Funding/VC Activities, and Technological Innovations
    2. 6.2. Precious Upload & Print
      1. 6.2.1. Company Overview
      2. 6.2.2. Product/Service Portfolio
      3. 6.2.3. Precious Upload & Print Sales, Revenue, and Gross Margin
      4. 6.2.4. Precious Upload & Print Revenue and Growth Rate
      5. 6.2.5. Precious Upload & Print Market Share
      6. 6.2.6. Recent Initiatives, Funding/VC Activities, and Technological Innovations
    3. 6.3. GUY & MAX
      1. 6.3.1. Company Overview
      2. 6.3.2. Product/Service Portfolio
      3. 6.3.3. GUY & MAX Sales, Revenue, and Gross Margin
      4. 6.3.4. GUY & MAX Revenue and Growth Rate
      5. 6.3.5. GUY & MAX Market Share
      6. 6.3.6. Recent Initiatives, Funding/VC Activities, and Technological Innovations
    4. 6.4. Nervous System
      1. 6.4.1. Company Overview
      2. 6.4.2. Product/Service Portfolio
      3. 6.4.3. Nervous System Sales, Revenue, and Gross Margin
      4. 6.4.4. Nervous System Revenue and Growth Rate
      5. 6.4.5. Nervous System Market Share
      6. 6.4.6. Recent Initiatives, Funding/VC Activities, and Technological Innovations
    5. 6.5. RADIAN
      1. 6.5.1. Company Overview
      2. 6.5.2. Product/Service Portfolio
      3. 6.5.3. RADIAN Sales, Revenue, and Gross Margin
      4. 6.5.4. RADIAN Revenue and Growth Rate
      5. 6.5.5. RADIAN Market Share
      6. 6.5.6. Recent Initiatives, Funding/VC Activities, and Technological Innovations
    6. 6.6. Diana Law
      1. 6.6.1. Company Overview
      2. 6.6.2. Product/Service Portfolio
      3. 6.6.3. Diana Law Sales, Revenue, and Gross Margin
      4. 6.6.4. Diana Law Revenue and Growth Rate
      5. 6.6.5. Diana Law Market Share
      6. 6.6.6. Recent Initiatives, Funding/VC Activities, and Technological Innovations
    7. 6.7. Isharya
      1. 6.7.1. Company Overview
      2. 6.7.2. Product/Service Portfolio
      3. 6.7.3. Isharya Sales, Revenue, and Gross Margin
      4. 6.7.4. Isharya Revenue and Growth Rate
      5. 6.7.5. Isharya Market Share
      6. 6.7.6. Recent Initiatives, Funding/VC Activities, and Technological Innovations
    8. 6.8. American Pearl
      1. 6.8.1. Company Overview
      2. 6.8.2. Product/Service Portfolio
      3. 6.8.3. American Pearl Sales, Revenue, and Gross Margin
      4. 6.8.4. American Pearl Revenue and Growth Rate
      5. 6.8.5. American Pearl Market Share
      6. 6.8.6. Recent Initiatives, Funding/VC Activities, and Technological Innovations
    9. 6.9. Anna
      1. 6.9.1. Company Overview
      2. 6.9.2. Product/Service Portfolio
      3. 6.9.3. Anna Sales, Revenue, and Gross Margin
      4. 6.9.4. Anna Revenue and Growth Rate
      5. 6.9.5. Anna Market Share
      6. 6.9.6. Recent Initiatives, Funding/VC Activities, and Technological Innovations
    10. 6.10. Pipa + Belle
      1. 6.10.1. Company Overview
      2. 6.10.2. Product/Service Portfolio
      3. 6.10.3. Pipa + Belle Sales, Revenue, and Gross Margin
      4. 6.10.4. Pipa + Belle Revenue and Growth Rate
      5. 6.10.5. Pipa + Belle Market Share
      6. 6.10.6. Recent Initiatives, Funding/VC Activities, and Technological Innovations
    11. 6.11. Melorra
      1. 6.11.1. Company Overview
      2. 6.11.2. Product/Service Portfolio
      3. 6.11.3. Melorra Sales, Revenue, and Gross Margin
      4. 6.11.4. Melorra Revenue and Growth Rate
      5. 6.11.5. Melorra Market Share
      6. 6.11.6. Recent Initiatives, Funding/VC Activities, and Technological Innovations
  7. Chapter 7 3D Printed Jewelry — Industry Analysis
    1. 7.1. Introduction and Taxonomy
    2. 7.2. 3D Printed Jewelry Market – Key Trends
      1. 7.2.1. Market Drivers
      2. 7.2.2. Market Restraints
      3. 7.2.3. Market Opportunities
    3. 7.3. Value Chain Analysis
    4. 7.4. Key Mandates and Regulations
    5. 7.5. Technology Roadmap and Timeline
    6. 7.6. 3D Printed Jewelry Market – Attractiveness Analysis
      1. 7.6.1. By Jewelry Type
      2. 7.6.2. By Technology
      3. 7.6.3. By Region
  8. Chapter 8 Industrial Chain, Sourcing Strategy, and Downstream Buyers
    1. 8.1. 3D Printed Jewelry Industrial Chain Analysis
    2. 8.2. Downstream Buyers
    3. 8.3. Distributors/Traders List
  9. Chapter 9 Marketing Strategy Analysis
    1. 9.1. Marketing Channel
    2. 9.2. Direct Marketing
    3. 9.3. Indirect Marketing
    4. 9.4. Marketing Channel Development Trends
    5. 9.5. Economic/Political Environmental Change
  10. Chapter 10 Report Conclusion & Key Insights
    1. 10.1. Key Insights from Primary Interviews & Surveys Respondents
    2. 10.2. Key Takeaways from Analysts, Consultants, and Industry Leaders
  11. Chapter 11 Research Approach & Methodology
    1. 11.1. Report Description
    2. 11.2. Research Scope
    3. 11.3. Research Methodology
      1. 11.3.1. Secondary Research
      2. 11.3.2. Primary Research
      3. 11.3.3. Statistical Models
        1. 11.3.3.1. Company Share Analysis Model
        2. 11.3.3.2. Revenue Based Modeling
      4. 11.3.4. Research Limitations

      List of Figures

      Fig.1 Product Picture of 3D Printed Jewelry
      Fig.2 Global 3D Printed Jewelry Market, 2016 – 2026 (USD Million)
      Fig.3 Global 3D Printed Jewelry Market Absolute Revenue Opportunity, 2016 – 2026 (USD Million)
      Fig.4 Global 3D Printed Jewelry Market Incremental Revenue Opportunity, 2020 – 2026 (USD Million)
      Fig.5 Global 3D Printed Jewelry Market Share, by Jewelry Type, 2019 & 2026 (USD Million)
      Fig.6 Global Gold 3D Printed Jewelry Market, 2016 – 2026 (USD Million)
      Fig.7 Global Silver 3D Printed Jewelry Market, 2016 – 2026 (USD Million)
      Fig.8 Global Brass 3D Printed Jewelry Market, 2016 – 2026 (USD Million)
      Fig.9 Global Bronze 3D Printed Jewelry Market, 2016 – 2026 (USD Million)
      Fig.10 Global Others 3D Printed Jewelry Market, 2016 – 2026 (USD Million)
      Fig.11 Global 3D Printed Jewelry Market Share, by Technology, 2019 & 2026 (USD Million)
      Fig.12 Global Stereolithography (SLA) 3D Printed Jewelry Market, 2016 – 2026 (USD Million)
      Fig.13 Global Fused depositing modelling (FDM) 3D Printed Jewelry Market, 2016 – 2026 (USD Million)
      Fig.14 Global Selective laser sintering (SLS) 3D Printed Jewelry Market, 2016 – 2026 (USD Million)
      Fig.15 Global Digital light processing (DLP) 3D Printed Jewelry Market, 2016 – 2026 (USD Million)
      Fig.16 Global Others 3D Printed Jewelry Market, 2016 – 2026 (USD Million)
      Fig.17 Global 3D Printed Jewelry Market Share, by Region, 2019 & 2026 (USD Million)
      Fig.18 North America 3D Printed Jewelry Market, 2016 – 2026 (USD Million)
      Fig.19 U.S. 3D Printed Jewelry Market, 2016 – 2026 (USD Million)
      Fig.20 Canada 3D Printed Jewelry Market, 2016 – 2026 (USD Million)
      Fig.21 Europe 3D Printed Jewelry Market, 2016 – 2026 (USD Million)
      Fig.22 Germany 3D Printed Jewelry Market, 2016 – 2026 (USD Million)
      Fig.23 France 3D Printed Jewelry Market, 2016 – 2026 (USD Million)
      Fig.24 U.K. 3D Printed Jewelry Market, 2016 – 2026 (USD Million)
      Fig.25 Italy 3D Printed Jewelry Market, 2016 – 2026 (USD Million)
      Fig.26 Spain 3D Printed Jewelry Market, 2016 – 2026 (USD Million)
      Fig.27 Rest of Europe 3D Printed Jewelry Market, 2016 – 2026 (USD Million)
      Fig.28 Asia Pacific 3D Printed Jewelry Market, 2016 – 2026 (USD Million)
      Fig.29 China 3D Printed Jewelry Market, 2016 – 2026 (USD Million)
      Fig.30 Japan 3D Printed Jewelry Market, 2016 – 2026 (USD Million)
      Fig.31 India 3D Printed Jewelry Market, 2016 – 2026 (USD Million)
      Fig.32 South  Korea 3D Printed Jewelry Market, 2016 – 2026 (USD Million)
      Fig.33 South-East Asia 3D Printed Jewelry Market, 2016 – 2026 (USD Million)
      Fig.34 Rest of Asia Pacific 3D Printed Jewelry Market, 2016 – 2026 (USD Million)
      Fig.35 Latin America 3D Printed Jewelry Market, 2016 – 2026 (USD Million)
      Fig.36 Brazil 3D Printed Jewelry Market, 2016 – 2026 (USD Million)
      Fig.37 Mexico 3D Printed Jewelry Market, 2016 – 2026 (USD Million)
      Fig.38 Rest of Latin America 3D Printed Jewelry Market, 2016 – 2026 (USD Million)
      Fig.39 The Middle-East and Africa 3D Printed Jewelry Market, 2016 – 2026 (USD Million)
      Fig.40 GCC Countries 3D Printed Jewelry Market, 2016 – 2026 (USD Million)
      Fig.41 South Africa 3D Printed Jewelry Market, 2016 – 2026 (USD Million)
      Fig.42 Rest of Middle-East Africa 3D Printed Jewelry Market, 2016 – 2026 (USD Million)
      Fig.43 Competitor Market Share – Revenue
      Fig.44 Mizaroh Revenue and Growth Rate
      Fig.45 Mizaroh Market Share
      Fig.46 Precious Upload & Print Revenue and Growth Rate
      Fig.47 Precious Upload & Print Market Share
      Fig.48 GUY & MAX Revenue and Growth Rate
      Fig.49 GUY & MAX Market Share
      Fig.50 Nervous System Revenue and Growth Rate
      Fig.51 Nervous System Market Share
      Fig.52 RADIAN Revenue and Growth Rate
      Fig.53 RADIAN Market Share
      Fig.54 Diana Law Revenue and Growth Rate
      Fig.55 Diana Law Market Share
      Fig.56 Isharya Revenue and Growth Rate
      Fig.57 Isharya Market Share
      Fig.58 American Pearl Revenue and Growth Rate
      Fig.59 American Pearl Market Share
      Fig.60 Anna Revenue and Growth Rate
      Fig.61 Anna Market Share
      Fig.62 Pipa + Belle Revenue and Growth Rate
      Fig.63 Pipa + Belle Market Share
      Fig.64 Melorra Revenue and Growth Rate
      Fig.65 Melorra Market Share
      Fig.66 Market Dynamics
      Fig.67 Global 3D Printed Jewelry – Value Chain Analysis
      Fig.68 Key Mandates and Regulations
      Fig.69 Technology Roadmap and Timeline
      Fig.70 Market Attractiveness Analysis – By Jewelry Type
      Fig.71 Market Attractiveness Analysis – By Technology
      Fig.72 Market Attractiveness Analysis – By Region
      Fig.73 3D Printed Jewelry Industrial Chain Analysis
      Fig.74 Market Channels
      Fig.75 Marketing Channel Development Trend
      Fig.76 Growth in World Gross Product, 2008-2018
      

      List of Tables

      Table 1 Global 3D Printed Jewelry Market, 2019 & 2026 (USD Million)
      Table 2 Global 3D Printed Jewelry Market, by Jewelry Type, 2016 – 2026 (USD Million)
      Table 3 Global 3D Printed Jewelry Market, by Technology, 2016 – 2026 (USD Million)
      Table 4 Global 3D Printed Jewelry Market, by Region, 2016 – 2026 (USD Million)
      Table 5 North America 3D Printed Jewelry Market, by Country, 2016 – 2026 (USD Million)
      Table 6 North America 3D Printed Jewelry Market, by Jewelry Type, 2016 – 2026 (USD Million)
      Table 7 North America 3D Printed Jewelry Market, by Technology, 2016 – 2026 (USD Million)
      Table 8 Europe 3D Printed Jewelry Market, by Country, 2016 – 2026 (USD Million)
      Table 9 Europe 3D Printed Jewelry Market, by Jewelry Type, 2016 – 2026 (USD Million)
      Table 10 Europe 3D Printed Jewelry Market, by Technology, 2016 – 2026 (USD Million)
      Table 11 Asia Pacific 3D Printed Jewelry Market, by Country, 2016 – 2026 (USD Million)
      Table 12 Asia Pacific 3D Printed Jewelry Market, by Jewelry Type, 2016 – 2026 (USD Million)
      Table 13 Asia Pacific 3D Printed Jewelry Market, by Technology, 2016 – 2026 (USD Million)
      Table 14 Latin America 3D Printed Jewelry Market, by Country, 2016 – 2026 (USD Million)
      Table 15 Latin America 3D Printed Jewelry Market, by Jewelry Type, 2016 – 2026 (USD Million)
      Table 16 Latin America 3D Printed Jewelry Market, by Technology, 2016 – 2026 (USD Million)
      Table 17 The Middle-East and Africa 3D Printed Jewelry Market, by Country, 2016 – 2026 (USD Million)
      Table 18 The Middle-East and Africa 3D Printed Jewelry Market, by Jewelry Type, 2016 – 2026 (USD Million)
      Table 19 The Middle-East and Africa 3D Printed Jewelry Market, by Technology, 2016 – 2026 (USD Million)
      Table 20 Global 3D Printed Jewelry Market - Company Revenue Analysis, 2016 – 2019 (USD Million)
      Table 21 Global 3D Printed Jewelry Market - Company Revenue Share Analysis, 2016 – 2019 (%)
      Table 22 Acquisitions and Mergers
      Table 23 Market Drivers – Impact Analysis
      Table 24 Market Restraints
      Table 25 Market Opportunities
      Table 26 Major Buyers of 3D Printed Jewelry
      Table 27 Distributors/Traders of 3D Printed Jewelry by Region
      

Industry Major Market Players

  • Mizaroh
  • Precious Upload & Print
  • GUY & MAX
  • Nervous System
  • RADIAN
  • Diana Law
  • Isharya
  • American Pearl
  • Anna
  • Pipa + Belle
  • Melorra