Search Market Research Report

Discover Our Latest Reports
Discover Our Featured Reports
Discover Top Selling Reports

3D Machine Vision Market Size, Share Global Analysis Report, 2021 – 2026

report img

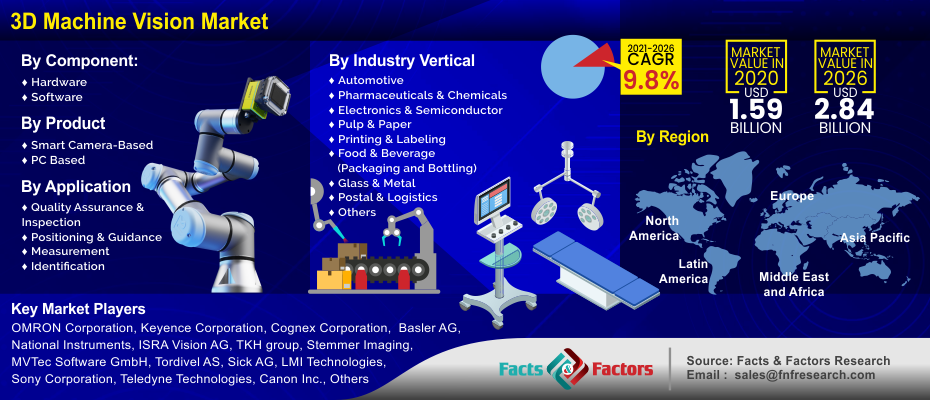
3D Machine Vision Market By Component (hardware and Software), By Product Type (Smart Camera-Based and PC Based), By Application (Quality Assurance & Inspection, Positioning & Guidance, Measurement and Identification), and By Industry Vertical (Automotive, Pharmaceuticals & Chemicals, Electronics & Semiconductor, Pulp & Paper, Printing & Labelling, Food & Beverage (Packaging and Bottling), Glass & Metal, Postal & Logistics, and Others): Global & Regional Industry Perspective, Comprehensive Analysis, and Forecast 2021 – 2026

Industry Insights

[196+ Pages Report] According to a Facts & Factors market research report, the global 3D machine vision market stood at about USD 1.59 Billion in 2020; further, this revenue is expected to touch USD 2.84 Billion by the year 2026, increasing at a CAGR of around 9.8% from 2021 to 2026.

logoMarket Overview

With technological innovation occurring at a faster rate than ever before, many once expensive technologies are being made significantly cheaper. And nowhere is this truer than in the field of 3D machine vision. While machine vision is no new technological development, the emergence of cheaper 3D imaging cameras and sensors has recently been the catalyst for a host of new applications for the technology. The majority of machine vision systems traditionally used 2D imaging to identify the position of products on a conveyor belt, for example. However, one of the biggest drawbacks of using two dimensions, x, and y, is that, in this example, the product's size and shape would need to be known in order for the system to work. Using three dimensions allows machine vision systems to extrapolate positions in the x, y, and z. Hence 3D machine vision systems are beginning to be applied in a variety of different roles. 3D machine vision can be roughly defined as technologies that allow for the three-dimensional measurement or inspection of 3D objects or surfaces. The different techniques in which 3D vision can be achieved are laser profiling, stereo imaging, fringe protection and time of flight techniques.

To know more about this report | Request Free Sample Copy

logoIndustry Growth Factors

3D machine vision creates a digitalized model of the specific shape and size of the object that it is scanning. 3D machine vision is capable of fusing various point clouds from various scanners. The term machine vision includes a variety of hardware and software products, technologies, actions, and integrated systems. 3D machine vision is used in various industrial verticals such as defense, automotive, healthcare, semiconductors, consumer electronics, and logistics. Depending upon where this technology is used, the end-users of 3D machine vision will possess different requirements. There has been a specific need and increase in the demand for automation and quality inspection across various sectors. Adaptation of automation particularly in the consumer electronics and automotive industries is continuously increasing and this will prove to be the major driving factor for 3D machine vision. Moreover, the rising technological advancements and favorable environment for manufacturing industries all over, are also supporting the growth of the 3D machine vision market.

logoGlobal 3D Machine Vision Market: Segmentation

Based on components, the 3D machine vision market is bifurcated into hardware and software. Based on product type the market is bifurcated into smart camera-based and PC-based. Based on application the market is bifurcated into quality assurance & inspection, positioning & guidance, measurement, and identification. Based on the industrial vertical the 3D machine vision market is bifurcated into automotive, pharmaceuticals & chemicals, electronics & semiconductor, pulp & paper, printing & labeling, food & beverage (packaging and bottling), glass & metal, postal & logistics, and others.

logoGlobal 3D Machine Vision Market: Regional Analysis

On a regional basis, the 3D machine vision market is divided into five major regions namely North America, Europe, Latin America, Asia Pacific, and The Middle East and Africa.

The region of Asia Pacific is comprised of some of the promising economies like Chine, Japan, India, South Korea, Australia, etc. The region is currently dominating the 3D machine vision market and is further expected to grow with the high CAGR in the forthcoming years. This anticipated growth is attributed to the increasing adoption of automation mostly across all industries but mainly in the consumer electronics and automotive sectors.

logoReport Scope

Report Attribute

Details

Market Size in 2020

USD 1.59 Billion

Projected Market Size in 2026

USD 2.84 Billion

Growth Rate

CAGR 9.8%

Base Year

2020

Forecast Years

2021–2026

Key Market Players

OMRON Corporation, Keyence Corporation, Cognex Corporation, Basler AG, National Instruments, ISRA Vision AG, TKH group, Stemmer Imaging, MVTec Software GmbH, Tordivel AS, Sick AG, LMI Technologies, Sony Corporation, Teledyne Technologies, Canon Inc., Balluff GmBH, Industrial Vision System, Intel Corporation, Robotic Vision Technologies, Inc., Coherent, Inc., Hermary Opto Electronics INC, Baumer Optronic GmbH, and Texas Instruments Incorporated among others.

Key Segment

By Component, By Product Type, By Application, By Industry Vertical, and By Region

Major Regions Covered

North America, Europe, Asia Pacific, Latin America, and the Middle East & Africa

Purchase Options

Request customized purchase options to meet your research needs. Explore purchase options

logoGlobal 3D Machine Vision Market: Competitive Players

Some of the key players in the 3D machine vision market are

  • OMRON Corporation
  • Keyence Corporation
  • Cognex Corporation
  • Basler AG
  • National Instruments
  • ISRA Vision AG
  • TKH group
  • Stemmer Imaging
  • MVTec Software GmbH
  • Tordivel AS
  • Sick AG
  • LMI Technologies
  • Sony Corporation
  • Teledyne Technologies
  • Canon Inc.
  • Balluff GmBH
  • Industrial Vision System
  • Intel Corporation
  • Robotic Vision Technologies Inc.
  • Coherent Inc.
  • Hermary Opto Electronics INC
  • Baumer Optronic GmbH
  • Texas Instruments Incorporated

logo By Component:

  • Hardware
  • Software

logo By Product Type:

  • Smart Camera-Based
  • PC Based

logo By Application:

  • Quality Assurance & Inspection
  • Positioning & Guidance
  • Measurement
  • Identification

logo By Industry Vertical:

  • Automotive
  • Pharmaceuticals & Chemicals
  • Electronics & Semiconductor
  • Pulp & Paper
  • Printing & Labeling
  • Food & Beverage (Packaging and Bottling)
  • Glass & Metal
  • Postal & Logistics
  • Others

logo By Region:

  • North America
    • The U.S.
    • Canada
  • Europe
    • France
    • The UK
    • Spain
    • Germany
    • Italy
    • Rest of Europe
  • Asia Pacific
    • China
    • Japan
    • India
    • South Korea
    • Southeast Asia
    • Rest of Asia Pacific
  • Latin America
    • Brazil
    • Mexico
    • Rest of Latin America
  • Middle East & Africa
    • GCC
    • South Africa
    • Rest of Middle East & Africa

Table of Content

  1. Chapter 1 Executive Summary
    1. 1.1. Introduction of 3D Machine Vision
    2. 1.2. Global 3D Machine Vision Market, 2020 & 2026 (USD Billion)
    3. 1.3. Global 3D Machine Vision Market, 2016 – 2026 (USD Billion)
    4. 1.4. Global 3D Machine Vision Market Absolute Revenue Opportunity, 2016 – 2026 (USD Billion)
    5. 1.5. Global 3D Machine Vision Market Incremental Revenue Opportunity, 2020 – 2026 (USD Billion)
    6. 1.6. COVID-19 Impacts on 3D Machine Vision Market
      1. 1.6.1. COVID-19 Impact on the Player
      2. 1.6.2. Business Strategies and Recommendations
  2. Chapter 2 3D Machine Vision Market – Component Analysis
    1. 2.1. Global 3D Machine Vision Market – Component Overview
    2. 2.2. Global 3D Machine Vision Market Share, by Component, 2020 & 2026 (USD Billion)
    3. 2.3. Hardware
      1. 2.3.1. Global Hardware 3D Machine Vision Market, 2016 – 2026 (USD Billion)
    4. 2.4. Software
      1. 2.4.1. Global Software 3D Machine Vision Market, 2016 – 2026 (USD Billion)
  3. Chapter 3 3D Machine Vision Market – Product Type Analysis
    1. 3.1. Global 3D Machine Vision Market – Product Type Overview
    2. 3.2. Global 3D Machine Vision Market Share, by Product Type, 2020 & 2026 (USD Billion)
    3. 3.3. Smart Camera-Based
      1. 3.3.1. Global Smart Camera-Based 3D Machine Vision Market, 2016 – 2026 (USD Billion)
    4. 3.4. PC Based
      1. 3.4.1. Global PC Based 3D Machine Vision Market, 2016 – 2026 (USD Billion)
  4. Chapter 4 3D Machine Vision Market – Application Analysis
    1. 4.1. Global 3D Machine Vision Market – Application Overview
    2. 4.2. Global 3D Machine Vision Market Share, by Application, 2020 & 2026 (USD Billion)
    3. 4.3. Quality Assurance & Inspection
      1. 4.3.1. Global Quality Assurance & Inspection 3D Machine Vision Market, 2016 – 2026 (USD Billion)
    4. 4.4. Positioning & Guidance
      1. 4.4.1. Global Positioning & Guidance 3D Machine Vision Market, 2016 – 2026 (USD Billion)
    5. 4.5. Measurement
      1. 4.5.1. Global Measurement 3D Machine Vision Market, 2016 – 2026 (USD Billion)
    6. 4.6. Identification
      1. 4.6.1. Global Identification 3D Machine Vision Market, 2016 – 2026 (USD Billion)
  5. Chapter 5 3D Machine Vision Market – Industry Vertical Analysis
    1. 5.1. Global 3D Machine Vision Market – Industry Vertical Overview
    2. 5.2. Global 3D Machine Vision Market Share, by Industry Vertical, 2020 & 2026 (USD Billion)
    3. 5.3. Automotive
      1. 5.3.1. Global Automotive 3D Machine Vision Market, 2016 – 2026 (USD Billion)
    4. 5.4. Pharmaceuticals & Chemicals
      1. 5.4.1. Global Pharmaceuticals & Chemicals 3D Machine Vision Market, 2016 – 2026 (USD Billion)
    5. 5.5. Electronics & Semiconductor
      1. 5.5.1. Global Electronics & Semiconductor 3D Machine Vision Market, 2016 – 2026 (USD Billion)
    6. 5.6. Pulp & Paper
      1. 5.6.1. Global Pulp & Paper 3D Machine Vision Market, 2016 – 2026 (USD Billion)
    7. 5.7. Printing & Labelling
      1. 5.7.1. Global Printing & Labelling 3D Machine Vision Market, 2016 – 2026 (USD Billion)
    8. 5.8. Food & Beverage (Packaging and Bottling)
      1. 5.8.1. Global Food & Beverage (Packaging and Bottling) 3D Machine Vision Market, 2016 – 2026 (USD Billion)
    9. 5.9. Glass & Metal
      1. 5.9.1. Global Glass & Metal 3D Machine Vision Market, 2016 – 2026 (USD Billion)
    10. 5.10. Postal & Logistics
      1. 5.10.1. Global Postal & Logistics 3D Machine Vision Market, 2016 – 2026 (USD Billion)
    11. 5.11. Others
      1. 5.11.1. Global Others 3D Machine Vision Market, 2016 – 2026 (USD Billion)
  6. Chapter 6 3D Machine Vision Market – Regional Analysis
    1. 6.1. Global 3D Machine Vision Market Regional Overview
    2. 6.2. Global 3D Machine Vision Market Share, by Region, 2020 & 2026 (USD Billion)
    3. 6.3. North America
      1. 6.3.1. North America 3D Machine Vision Market, 2016 – 2026 (USD Billion)
        1. 6.3.1.1. North America 3D Machine Vision Market, by Country, 2016 - 2026 (USD Billion)
      2. 6.3.2. North America 3D Machine Vision Market, by Component, 2016 – 2026
        1. 6.3.2.1. North America 3D Machine Vision Market, by Component, 2016 – 2026 (USD Billion)
      3. 6.3.3. North America 3D Machine Vision Market, by Product Type, 2016 – 2026
        1. 6.3.3.1. North America 3D Machine Vision Market, by Product Type, 2016 – 2026 (USD Billion)
      4. 6.3.4. North America 3D Machine Vision Market, by Application, 2016 – 2026
        1. 6.3.4.1. North America 3D Machine Vision Market, by Application, 2016 – 2026 (USD Billion)
      5. 6.3.5. North America 3D Machine Vision Market, by Industry Vertical, 2016 – 2026
        1. 6.3.5.1. North America 3D Machine Vision Market, by Industry Vertical, 2016 – 2026 (USD Billion)
      6. 6.3.6. U.S.
        1. 6.3.6.1. U.S. 3D Machine Vision Market, 2016 – 2026 (USD Billion)
      7. 6.3.7. Canada
        1. 6.3.7.1. Canada 3D Machine Vision Market, 2016 – 2026 (USD Billion)
    4. 6.4. Europe
      1. 6.4.1. Europe 3D Machine Vision Market, 2016 – 2026 (USD Billion)
        1. 6.4.1.1. Europe 3D Machine Vision Market, by Country, 2016 - 2026 (USD Billion)
      2. 6.4.2. Europe 3D Machine Vision Market, by Component, 2016 – 2026
        1. 6.4.2.1. Europe 3D Machine Vision Market, by Component, 2016 – 2026 (USD Billion)
      3. 6.4.3. Europe 3D Machine Vision Market, by Product Type, 2016 – 2026
        1. 6.4.3.1. Europe 3D Machine Vision Market, by Product Type, 2016 – 2026 (USD Billion)
      4. 6.4.4. Europe 3D Machine Vision Market, by Application, 2016 – 2026
        1. 6.4.4.1. Europe 3D Machine Vision Market, by Application, 2016 – 2026 (USD Billion)
      5. 6.4.5. Europe 3D Machine Vision Market, by Industry Vertical, 2016 – 2026
        1. 6.4.5.1. Europe 3D Machine Vision Market, by Industry Vertical, 2016 – 2026 (USD Billion)
      6. 6.4.6. Germany
        1. 6.4.6.1. Germany 3D Machine Vision Market, 2016 – 2026 (USD Billion)
      7. 6.4.7. France
        1. 6.4.7.1. France 3D Machine Vision Market, 2016 – 2026 (USD Billion)
      8. 6.4.8. U.K.
        1. 6.4.8.1. U.K. 3D Machine Vision Market, 2016 – 2026 (USD Billion)
      9. 6.4.9. Italy
        1. 6.4.9.1. Italy 3D Machine Vision Market, 2016 – 2026 (USD Billion)
      10. 6.4.10. Spain
        1. 6.4.10.1. Spain 3D Machine Vision Market, 2016 – 2026 (USD Billion)
      11. 6.4.11. Rest of Europe
        1. 6.4.11.1. Rest of Europe 3D Machine Vision Market, 2016 – 2026 (USD Billion)
    5. 6.5. Asia Pacific
      1. 6.5.1. Asia Pacific 3D Machine Vision Market, 2016 – 2026 (USD Billion)
        1. 6.5.1.1. Asia Pacific 3D Machine Vision Market, by Country, 2016 - 2026 (USD Billion)
      2. 6.5.2. Asia Pacific 3D Machine Vision Market, by Component, 2016 – 2026
        1. 6.5.2.1. Asia Pacific 3D Machine Vision Market, by Component, 2016 – 2026 (USD Billion)
      3. 6.5.3. Asia Pacific 3D Machine Vision Market, by Product Type, 2016 – 2026
        1. 6.5.3.1. Asia Pacific 3D Machine Vision Market, by Product Type, 2016 – 2026 (USD Billion)
      4. 6.5.4. Asia Pacific 3D Machine Vision Market, by Application, 2016 – 2026
        1. 6.5.4.1. Asia Pacific 3D Machine Vision Market, by Application, 2016 – 2026 (USD Billion)
      5. 6.5.5. Asia Pacific 3D Machine Vision Market, by Industry Vertical, 2016 – 2026
        1. 6.5.5.1. Asia Pacific 3D Machine Vision Market, by Industry Vertical, 2016 – 2026 (USD Billion)
      6. 6.5.6. China
        1. 6.5.6.1. China 3D Machine Vision Market, 2016 – 2026 (USD Billion)
      7. 6.5.7. Japan
        1. 6.5.7.1. Japan 3D Machine Vision Market, 2016 – 2026 (USD Billion)
      8. 6.5.8. India
        1. 6.5.8.1. India 3D Machine Vision Market, 2016 – 2026 (USD Billion)
      9. 6.5.9. South Korea
        1. 6.5.9.1. South Korea 3D Machine Vision Market, 2016 – 2026 (USD Billion)
      10. 6.5.10. South-East Asia
        1. 6.5.10.1. South-East Asia 3D Machine Vision Market, 2016 – 2026 (USD Billion)
      11. 6.5.11. Rest of Asia Pacific
        1. 6.5.11.1. Rest of Asia Pacific 3D Machine Vision Market, 2016 – 2026 (USD Billion)
    6. 6.6. Latin America
      1. 6.6.1. Latin America 3D Machine Vision Market, 2016 – 2026 (USD Billion)
        1. 6.6.1.1. Latin America 3D Machine Vision Market, by Country, 2016 - 2026 (USD Billion)
      2. 6.6.2. Latin America 3D Machine Vision Market, by Component, 2016 – 2026
        1. 6.6.2.1. Latin America 3D Machine Vision Market, by Component, 2016 – 2026 (USD Billion)
      3. 6.6.3. Latin America 3D Machine Vision Market, by Product Type, 2016 – 2026
        1. 6.6.3.1. Latin America 3D Machine Vision Market, by Product Type, 2016 – 2026 (USD Billion)
      4. 6.6.4. Latin America 3D Machine Vision Market, by Application, 2016 – 2026
        1. 6.6.4.1. Latin America 3D Machine Vision Market, by Application, 2016 – 2026 (USD Billion)
      5. 6.6.5. Latin America 3D Machine Vision Market, by Industry Vertical, 2016 – 2026
        1. 6.6.5.1. Latin America 3D Machine Vision Market, by Industry Vertical, 2016 – 2026 (USD Billion)
      6. 6.6.6. Brazil
        1. 6.6.6.1. Brazil 3D Machine Vision Market, 2016 – 2026 (USD Billion)
      7. 6.6.7. Mexico
        1. 6.6.7.1. Mexico 3D Machine Vision Market, 2016 – 2026 (USD Billion)
      8. 6.6.8. Rest of Latin America
        1. 6.6.8.1. Rest of Latin America 3D Machine Vision Market, 2016 – 2026 (USD Billion)
    7. 6.7. The Middle-East and Africa
      1. 6.7.1. The Middle-East and Africa 3D Machine Vision Market, 2016 – 2026 (USD Billion)
        1. 6.7.1.1. The Middle-East and Africa 3D Machine Vision Market, by Country, 2016 - 2026 (USD Billion)
      2. 6.7.2. The Middle-East and Africa 3D Machine Vision Market, by Component, 2016 – 2026
        1. 6.7.2.1. The Middle-East and Africa 3D Machine Vision Market, by Component, 2016 – 2026 (USD Billion)
      3. 6.7.3. The Middle-East and Africa 3D Machine Vision Market, by Product Type, 2016 – 2026
        1. 6.7.3.1. The Middle-East and Africa 3D Machine Vision Market, by Product Type, 2016 – 2026 (USD Billion)
      4. 6.7.4. The Middle-East and Africa 3D Machine Vision Market, by Application, 2016 – 2026
        1. 6.7.4.1. The Middle-East and Africa 3D Machine Vision Market, by Application, 2016 – 2026 (USD Billion)
      5. 6.7.5. The Middle-East and Africa 3D Machine Vision Market, by Industry Vertical, 2016 – 2026
        1. 6.7.5.1. The Middle-East and Africa 3D Machine Vision Market, by Industry Vertical, 2016 – 2026 (USD Billion)
      6. 6.7.6. GCC Countries
        1. 6.7.6.1. GCC Countries 3D Machine Vision Market, 2016 – 2026 (USD Billion)
      7. 6.7.7. South Africa
        1. 6.7.7.1. South Africa 3D Machine Vision Market, 2016 – 2026 (USD Billion)
      8. 6.7.8. Rest of Middle-East Africa
        1. 6.7.8.1. Rest of Middle-East Africa 3D Machine Vision Market, 2016 – 2026 (USD Billion)
  7. Chapter 7 3D Machine Vision Market – Competitive Landscape
    1. 7.1. Competitor Market Share – Revenue
    2. 7.2. Market Concentration Rate Analysis, Top 3 and Top 5 Players
    3. 7.3. Strategic Developments
      1. 7.3.1. Acquisitions and Mergers
      2. 7.3.2. New Products
      3. 7.3.3. Research & Development Activities
  8. Chapter 8 Company Profiles
    1. 8.1. OMRON Corporation
      1. 8.1.1. Company Overview
      2. 8.1.2. Product/Service Portfolio
      3. 8.1.3. OMRON Corporation Sales, Revenue, and Gross Margin
      4. 8.1.4. OMRON Corporation Revenue and Growth Rate
      5. 8.1.5. OMRON Corporation Market Share
      6. 8.1.6. Recent Initiatives, Funding/VC Activities, and Technological Innovations
    2. 8.2. Keyence Corporation
      1. 8.2.1. Company Overview
      2. 8.2.2. Product/Service Portfolio
      3. 8.2.3. Keyence Corporation Sales, Revenue, and Gross Margin
      4. 8.2.4. Keyence Corporation Revenue and Growth Rate
      5. 8.2.5. Keyence Corporation Market Share
      6. 8.2.6. Recent Initiatives, Funding/VC Activities, and Technological Innovations
    3. 8.3. Cognex Corporation
      1. 8.3.1. Company Overview
      2. 8.3.2. Product/Service Portfolio
      3. 8.3.3. Cognex Corporation Sales, Revenue, and Gross Margin
      4. 8.3.4. Cognex Corporation Revenue and Growth Rate
      5. 8.3.5. Cognex Corporation Market Share
      6. 8.3.6. Recent Initiatives, Funding/VC Activities, and Technological Innovations
    4. 8.4. Basler AG
      1. 8.4.1. Company Overview
      2. 8.4.2. Product/Service Portfolio
      3. 8.4.3. Basler AG Sales, Revenue, and Gross Margin
      4. 8.4.4. Basler AG Revenue and Growth Rate
      5. 8.4.5. Basler AG Market Share
      6. 8.4.6. Recent Initiatives, Funding/VC Activities, and Technological Innovations
    5. 8.5. National Instruments
      1. 8.5.1. Company Overview
      2. 8.5.2. Product/Service Portfolio
      3. 8.5.3. National Instruments Sales, Revenue, and Gross Margin
      4. 8.5.4. National Instruments Revenue and Growth Rate
      5. 8.5.5. National Instruments Market Share
      6. 8.5.6. Recent Initiatives, Funding/VC Activities, and Technological Innovations
    6. 8.6. ISRA Vision AG
      1. 8.6.1. Company Overview
      2. 8.6.2. Product/Service Portfolio
      3. 8.6.3. ISRA Vision AG Sales, Revenue, and Gross Margin
      4. 8.6.4. ISRA Vision AG Revenue and Growth Rate
      5. 8.6.5. ISRA Vision AG Market Share
      6. 8.6.6. Recent Initiatives, Funding/VC Activities, and Technological Innovations
    7. 8.7. TKH group
      1. 8.7.1. Company Overview
      2. 8.7.2. Product/Service Portfolio
      3. 8.7.3. TKH group Sales, Revenue, and Gross Margin
      4. 8.7.4. TKH group Revenue and Growth Rate
      5. 8.7.5. TKH group Market Share
      6. 8.7.6. Recent Initiatives, Funding/VC Activities, and Technological Innovations
    8. 8.8. Stemmer Imaging
      1. 8.8.1. Company Overview
      2. 8.8.2. Product/Service Portfolio
      3. 8.8.3. Stemmer Imaging Sales, Revenue, and Gross Margin
      4. 8.8.4. Stemmer Imaging Revenue and Growth Rate
      5. 8.8.5. Stemmer Imaging Market Share
      6. 8.8.6. Recent Initiatives, Funding/VC Activities, and Technological Innovations
    9. 8.9. MVTec Software GmbH
      1. 8.9.1. Company Overview
      2. 8.9.2. Product/Service Portfolio
      3. 8.9.3. MVTec Software GmbH Sales, Revenue, and Gross Margin
      4. 8.9.4. MVTec Software GmbH Revenue and Growth Rate
      5. 8.9.5. MVTec Software GmbH Market Share
      6. 8.9.6. Recent Initiatives, Funding/VC Activities, and Technological Innovations
    10. 8.10. Tordivel AS
      1. 8.10.1. Company Overview
      2. 8.10.2. Product/Service Portfolio
      3. 8.10.3. Tordivel AS Sales, Revenue, and Gross Margin
      4. 8.10.4. Tordivel AS Revenue and Growth Rate
      5. 8.10.5. Tordivel AS Market Share
      6. 8.10.6. Recent Initiatives, Funding/VC Activities, and Technological Innovations
    11. 8.11. Sick AG
      1. 8.11.1. Company Overview
      2. 8.11.2. Product/Service Portfolio
      3. 8.11.3. Sick AG Sales, Revenue, and Gross Margin
      4. 8.11.4. Sick AG Revenue and Growth Rate
      5. 8.11.5. Sick AG Market Share
      6. 8.11.6. Recent Initiatives, Funding/VC Activities, and Technological Innovations
    12. 8.12. LMI Technologies
      1. 8.12.1. Company Overview
      2. 8.12.2. Product/Service Portfolio
      3. 8.12.3. LMI Technologies Sales, Revenue, and Gross Margin
      4. 8.12.4. LMI Technologies Revenue and Growth Rate
      5. 8.12.5. LMI Technologies Market Share
      6. 8.12.6. Recent Initiatives, Funding/VC Activities, and Technological Innovations
    13. 8.13. Sony Corporation
      1. 8.13.1. Company Overview
      2. 8.13.2. Product/Service Portfolio
      3. 8.13.3. Sony Corporation Sales, Revenue, and Gross Margin
      4. 8.13.4. Sony Corporation Revenue and Growth Rate
      5. 8.13.5. Sony Corporation Market Share
      6. 8.13.6. Recent Initiatives, Funding/VC Activities, and Technological Innovations
    14. 8.14. Teledyne Technologies
      1. 8.14.1. Company Overview
      2. 8.14.2. Product/Service Portfolio
      3. 8.14.3. Teledyne Technologies Sales, Revenue, and Gross Margin
      4. 8.14.4. Teledyne Technologies Revenue and Growth Rate
      5. 8.14.5. Teledyne Technologies Market Share
      6. 8.14.6. Recent Initiatives, Funding/VC Activities, and Technological Innovations
    15. 8.15. Canon Inc.
      1. 8.15.1. Company Overview
      2. 8.15.2. Product/Service Portfolio
      3. 8.15.3. Canon Inc. Sales, Revenue, and Gross Margin
      4. 8.15.4. Canon Inc. Revenue and Growth Rate
      5. 8.15.5. Canon Inc. Market Share
      6. 8.15.6. Recent Initiatives, Funding/VC Activities, and Technological Innovations
    16. 8.16. Balluff GmBH
      1. 8.16.1. Company Overview
      2. 8.16.2. Product/Service Portfolio
      3. 8.16.3. Balluff GmBH Sales, Revenue, and Gross Margin
      4. 8.16.4. Balluff GmBH Revenue and Growth Rate
      5. 8.16.5. Balluff GmBH Market Share
      6. 8.16.6. Recent Initiatives, Funding/VC Activities, and Technological Innovations
    17. 8.17. Industrial Vision System
      1. 8.17.1. Company Overview
      2. 8.17.2. Product/Service Portfolio
      3. 8.17.3. Industrial Vision System Sales, Revenue, and Gross Margin
      4. 8.17.4. Industrial Vision System Revenue and Growth Rate
      5. 8.17.5. Industrial Vision System Market Share
      6. 8.17.6. Recent Initiatives, Funding/VC Activities, and Technological Innovations
    18. 8.18. Intel Corporation
      1. 8.18.1. Company Overview
      2. 8.18.2. Product/Service Portfolio
      3. 8.18.3. Intel Corporation Sales, Revenue, and Gross Margin
      4. 8.18.4. Intel Corporation Revenue and Growth Rate
      5. 8.18.5. Intel Corporation Market Share
      6. 8.18.6. Recent Initiatives, Funding/VC Activities, and Technological Innovations
    19. 8.19. Robotic Vision Technologies, Inc.
      1. 8.19.1. Company Overview
      2. 8.19.2. Product/Service Portfolio
      3. 8.19.3. Robotic Vision Technologies, Inc. Sales, Revenue, and Gross Margin
      4. 8.19.4. Robotic Vision Technologies, Inc. Revenue and Growth Rate
      5. 8.19.5. Robotic Vision Technologies, Inc. Market Share
      6. 8.19.6. Recent Initiatives, Funding/VC Activities, and Technological Innovations
    20. 8.20. Coherent, Inc.
      1. 8.20.1. Company Overview
      2. 8.20.2. Product/Service Portfolio
      3. 8.20.3. Coherent, Inc. Sales, Revenue, and Gross Margin
      4. 8.20.4. Coherent, Inc. Revenue and Growth Rate
      5. 8.20.5. Coherent, Inc. Market Share
      6. 8.20.6. Recent Initiatives, Funding/VC Activities, and Technological Innovations
    21. 8.21. Hermary Opto Electronics INC
      1. 8.21.1. Company Overview
      2. 8.21.2. Product/Service Portfolio
      3. 8.21.3. Hermary Opto Electronics INC Sales, Revenue, and Gross Margin
      4. 8.21.4. Hermary Opto Electronics INC Revenue and Growth Rate
      5. 8.21.5. Hermary Opto Electronics INC Market Share
      6. 8.21.6. Recent Initiatives, Funding/VC Activities, and Technological Innovations
    22. 8.22. Baumer Optronic GmbH
      1. 8.22.1. Company Overview
      2. 8.22.2. Product/Service Portfolio
      3. 8.22.3. Baumer Optronic GmbH Sales, Revenue, and Gross Margin
      4. 8.22.4. Baumer Optronic GmbH Revenue and Growth Rate
      5. 8.22.5. Baumer Optronic GmbH Market Share
      6. 8.22.6. Recent Initiatives, Funding/VC Activities, and Technological Innovations
    23. 8.23. Texas Instruments Incorporated
      1. 8.23.1. Company Overview
      2. 8.23.2. Product/Service Portfolio
      3. 8.23.3. Texas Instruments Incorporated Sales, Revenue, and Gross Margin
      4. 8.23.4. Texas Instruments Incorporated Revenue and Growth Rate
      5. 8.23.5. Texas Instruments Incorporated Market Share
      6. 8.23.6. Recent Initiatives, Funding/VC Activities, and Technological Innovations
  9. Chapter 9 3D Machine Vision — Industry Analysis
    1. 9.1. Introduction and Taxonomy
    2. 9.2. 3D Machine Vision Market – Key Trends
      1. 9.2.1. Market Drivers
      2. 9.2.2. Market Restraints
      3. 9.2.3. Market Opportunities
    3. 9.3. Value Chain Analysis
    4. 9.4. Key Mandates and Regulations
    5. 9.5. Porter’s Five Forces Model
      1. 9.5.1. Bargaining Power of Buyers
      2. 9.5.2. Bargaining Power of Suppliers
      3. 9.5.3. Threat of Substitute
      4. 9.5.4. Threat of New Entrants
      5. 9.5.5. Rivalry among Existing Competitors
    6. 9.6. PESTEL Analysis
    7. 9.7. SWOT Analysis
    8. 9.8. Technology Roadmap and Timeline
    9. 9.9. 3D Machine Vision Market – Attractiveness Analysis
      1. 9.9.1. By Component
      2. 9.9.2. By Product Type
      3. 9.9.3. By Application
      4. 9.9.4. By Industry Vertical
      5. 9.9.5. By Region
  10. Chapter 10 Industrial Chain, Sourcing Strategy, and Downstream Buyers
    1. 10.1. 3D Machine Vision Industrial Chain Analysis
    2. 10.2. Downstream Buyers
    3. 10.3. Distributors/Traders List
  11. Chapter 11 Marketing Strategy Analysis
    1. 11.1. Marketing Channel
    2. 11.2. Direct Marketing
    3. 11.3. Indirect Marketing
    4. 11.4. Marketing Channel Development Trends
    5. 11.5. Economic/Political Environmental Change
  12. Chapter 12 Report Conclusion & Key Insights
    1. 12.1. Key Insights from Primary Interviews & Surveys Respondents
    2. 12.2. Key Takeaways from Analysts, Consultants, and Industry Leaders
  13. Chapter 13 Research Approach & Methodology
    1. 13.1. Report Description
    2. 13.2. Research Scope
    3. 13.3. Research Methodology
      1. 13.3.1. Secondary Research
      2. 13.3.2. Primary Research
      3. 13.3.3. Statistical Models
        1. 13.3.3.1. Company Share Analysis Model
        2. 13.3.3.2. Revenue Based Modeling
      4. 13.3.4. Research Limitations

      List of Figures

      Fig.1	Product Picture of 3D Machine Vision
      Fig.2	Global 3D Machine Vision Market, 2016 – 2026 (USD Billion)
      Fig.3	Global 3D Machine Vision Market Absolute Revenue Opportunity, 2016 – 2026 (USD Billion)
      Fig.4	Global 3D Machine Vision Market Incremental Revenue Opportunity, 2020 – 2026 (USD Billion)
      Fig.5	COVID-19 Impacts on 3D Machine Vision Market
      Fig.6	COVID-19 Impact on the Player
      Fig.7	Business Strategies and Recommendations
      Fig.8	Global 3D Machine Vision Market Share, by Component, 2020 & 2026 (USD Billion)
      Fig.9	Global Hardware 3D Machine Vision Market, 2016 – 2026 (USD Billion)
      Fig.10	Global Software 3D Machine Vision Market, 2016 – 2026 (USD Billion)
      Fig.11	Global 3D Machine Vision Market Share, by Product Type, 2020 & 2026 (USD Billion)
      Fig.12	Global Smart Camera-Based 3D Machine Vision Market, 2016 – 2026 (USD Billion)
      Fig.13	Global PC Based 3D Machine Vision Market, 2016 – 2026 (USD Billion)
      Fig.14	Global 3D Machine Vision Market Share, by Application, 2020 & 2026 (USD Billion)
      Fig.15	Global Quality Assurance & Inspection 3D Machine Vision Market, 2016 – 2026 (USD Billion)
      Fig.16	Global Positioning & Guidance 3D Machine Vision Market, 2016 – 2026 (USD Billion)
      Fig.17	Global Measurement 3D Machine Vision Market, 2016 – 2026 (USD Billion)
      Fig.18	Global Identification 3D Machine Vision Market, 2016 – 2026 (USD Billion)
      Fig.19	Global 3D Machine Vision Market Share, by Industry Vertical, 2020 & 2026 (USD Billion)
      Fig.20	Global Automotive 3D Machine Vision Market, 2016 – 2026 (USD Billion)
      Fig.21	Global Pharmaceuticals & Chemicals 3D Machine Vision Market, 2016 – 2026 (USD Billion)
      Fig.22	Global Electronics & Semiconductor 3D Machine Vision Market, 2016 – 2026 (USD Billion)
      Fig.23	Global Pulp & Paper 3D Machine Vision Market, 2016 – 2026 (USD Billion)
      Fig.24	Global Printing & Labelling 3D Machine Vision Market, 2016 – 2026 (USD Billion)
      Fig.25	Global Food & Beverage (Packaging and Bottling) 3D Machine Vision Market, 2016 – 2026 (USD Billion)
      Fig.26	Global Glass & Metal 3D Machine Vision Market, 2016 – 2026 (USD Billion)
      Fig.27	Global Postal & Logistics 3D Machine Vision Market, 2016 – 2026 (USD Billion)
      Fig.28	Global Others 3D Machine Vision Market, 2016 – 2026 (USD Billion)
      Fig.29	Global 3D Machine Vision Market Share, by Region, 2020 & 2026 (USD Billion)
      Fig.30	North America 3D Machine Vision Market, 2016 – 2026 (USD Billion)
      Fig.31	U.S. 3D Machine Vision Market, 2016 – 2026 (USD Billion)
      Fig.32	Canada 3D Machine Vision Market, 2016 – 2026 (USD Billion)
      Fig.33	Europe 3D Machine Vision Market, 2016 – 2026 (USD Billion)
      Fig.34	Germany 3D Machine Vision Market, 2016 – 2026 (USD Billion)
      Fig.35	France 3D Machine Vision Market, 2016 – 2026 (USD Billion)
      Fig.36	U.K. 3D Machine Vision Market, 2016 – 2026 (USD Billion)
      Fig.37	Italy 3D Machine Vision Market, 2016 – 2026 (USD Billion)
      Fig.38	Spain 3D Machine Vision Market, 2016 – 2026 (USD Billion)
      Fig.39	Rest of Europe 3D Machine Vision Market, 2016 – 2026 (USD Billion)
      Fig.40	Asia Pacific 3D Machine Vision Market, 2016 – 2026 (USD Billion)
      Fig.41	China 3D Machine Vision Market, 2016 – 2026 (USD Billion)
      Fig.42	Japan 3D Machine Vision Market, 2016 – 2026 (USD Billion)
      Fig.43	India 3D Machine Vision Market, 2016 – 2026 (USD Billion)
      Fig.44	South  Korea 3D Machine Vision Market, 2016 – 2026 (USD Billion)
      Fig.45	South-East Asia 3D Machine Vision Market, 2016 – 2026 (USD Billion)
      Fig.46	Rest of Asia Pacific 3D Machine Vision Market, 2016 – 2026 (USD Billion)
      Fig.47	Latin America 3D Machine Vision Market, 2016 – 2026 (USD Billion)
      Fig.48	Brazil 3D Machine Vision Market, 2016 – 2026 (USD Billion)
      Fig.49	Mexico 3D Machine Vision Market, 2016 – 2026 (USD Billion)
      Fig.50	Rest of Latin America 3D Machine Vision Market, 2016 – 2026 (USD Billion)
      Fig.51	The Middle-East and Africa 3D Machine Vision Market, 2016 – 2026 (USD Billion)
      Fig.52	GCC Countries 3D Machine Vision Market, 2016 – 2026 (USD Billion)
      Fig.53	South Africa 3D Machine Vision Market, 2016 – 2026 (USD Billion)
      Fig.54	Rest of Middle-East Africa 3D Machine Vision Market, 2016 – 2026 (USD Billion)
      Fig.55	Competitor Market Share – Revenue
      Fig.56	OMRON Corporation Revenue and Growth Rate
      Fig.57	OMRON Corporation Market Share
      Fig.58	Keyence Corporation Revenue and Growth Rate
      Fig.59	Keyence Corporation Market Share
      Fig.60	Cognex Corporation Revenue and Growth Rate
      Fig.61	Cognex Corporation Market Share
      Fig.62	Basler AG Revenue and Growth Rate
      Fig.63	Basler AG Market Share
      Fig.64	National Instruments Revenue and Growth Rate
      Fig.65	National Instruments Market Share
      Fig.66	ISRA Vision AG Revenue and Growth Rate
      Fig.67	ISRA Vision AG Market Share
      Fig.68	TKH group Revenue and Growth Rate
      Fig.69	TKH group Market Share
      Fig.70	Stemmer Imaging Revenue and Growth Rate
      Fig.71	Stemmer Imaging Market Share
      Fig.72	MVTec Software GmbH Revenue and Growth Rate
      Fig.73	MVTec Software GmbH Market Share
      Fig.74	Tordivel AS Revenue and Growth Rate
      Fig.75	Tordivel AS Market Share
      Fig.76	Sick AG Revenue and Growth Rate
      Fig.77	Sick AG Market Share
      Fig.78	LMI Technologies Revenue and Growth Rate
      Fig.79	LMI Technologies Market Share
      Fig.80	Sony Corporation Revenue and Growth Rate
      Fig.81	Sony Corporation Market Share
      Fig.82	Teledyne Technologies Revenue and Growth Rate
      Fig.83	Teledyne Technologies Market Share
      Fig.84	Canon Inc. Revenue and Growth Rate
      Fig.85	Canon Inc. Market Share
      Fig.86	Balluff GmBH Revenue and Growth Rate
      Fig.87	Balluff GmBH Market Share
      Fig.88	Industrial Vision System Revenue and Growth Rate
      Fig.89	Industrial Vision System Market Share
      Fig.90	Intel Corporation Revenue and Growth Rate
      Fig.91	Intel Corporation Market Share
      Fig.92	Robotic Vision Technologies, Inc. Revenue and Growth Rate
      Fig.93	Robotic Vision Technologies, Inc. Market Share
      Fig.94	Coherent, Inc. Revenue and Growth Rate
      Fig.95	Coherent, Inc. Market Share
      Fig.96	Hermary Opto Electronics INC Revenue and Growth Rate
      Fig.97	Hermary Opto Electronics INC Market Share
      Fig.98	Baumer Optronic GmbH Revenue and Growth Rate
      Fig.99	Baumer Optronic GmbH Market Share
      Fig.100	Texas Instruments Incorporated Revenue and Growth Rate
      Fig.101	Texas Instruments Incorporated Market Share
      Fig.102	Market Dynamics
      Fig.103	Global 3D Machine Vision – Value Chain Analysis
      Fig.104	Key Mandates and Regulations
      Fig.105	PESTEL Analysis
      Fig.106	SWOT Analysis
      Fig.107	Technology Roadmap and Timeline
      Fig.108	Market Attractiveness Analysis – By Component
      Fig.109	Market Attractiveness Analysis – By Product Type
      Fig.110	Market Attractiveness Analysis – By Application
      Fig.111	Market Attractiveness Analysis – By Industry Vertical
      Fig.112	Market Attractiveness Analysis – By Region
      Fig.113	3D Machine Vision Industrial Chain Analysis
      Fig.114	Market Channels
      Fig.115	Marketing Channel Development Trend
      Fig.116	Growth in World Gross Product, 2008-2018
      

      List of Tables

      	
      Table 1	Global 3D Machine Vision Market, 2020 & 2026 (USD Billion)
      Table 2	Global 3D Machine Vision Market, by Component, 2016 – 2026 (USD Billion)
      Table 3	Global 3D Machine Vision Market, by Product Type, 2016 – 2026 (USD Billion)
      Table 4	Global 3D Machine Vision Market, by Application, 2016 – 2026 (USD Billion)
      Table 5	Global 3D Machine Vision Market, by Industry Vertical, 2016 – 2026 (USD Billion)
      Table 6	Global 3D Machine Vision Market, by Region, 2016 – 2026 (USD Billion)
      Table 7	North America 3D Machine Vision Market, by Country, 2016 – 2026 (USD Billion)
      Table 8	North America 3D Machine Vision Market, by Component, 2016 – 2026 (USD Billion)
      Table 9	North America 3D Machine Vision Market, by Product Type, 2016 – 2026 (USD Billion)
      Table 10 North America 3D Machine Vision Market, by Application, 2016 – 2026 (USD Billion)
      Table 11 North America 3D Machine Vision Market, by Industry Vertical, 2016 – 2026 (USD Billion)
      Table 12 Europe 3D Machine Vision Market, by Country, 2016 – 2026 (USD Billion)
      Table 13 Europe 3D Machine Vision Market, by Component, 2016 – 2026 (USD Billion)
      Table 14 Europe 3D Machine Vision Market, by Product Type, 2016 – 2026 (USD Billion)
      Table 15 Europe 3D Machine Vision Market, by Application, 2016 – 2026 (USD Billion)
      Table 16 Europe 3D Machine Vision Market, by Industry Vertical, 2016 – 2026 (USD Billion)
      Table 17 Asia Pacific 3D Machine Vision Market, by Country, 2016 – 2026 (USD Billion)
      Table 18 Asia Pacific 3D Machine Vision Market, by Component, 2016 – 2026 (USD Billion)
      Table 19 Asia Pacific 3D Machine Vision Market, by Product Type, 2016 – 2026 (USD Billion)
      Table 20 Asia Pacific 3D Machine Vision Market, by Application, 2016 – 2026 (USD Billion)
      Table 21 Asia Pacific 3D Machine Vision Market, by Industry Vertical, 2016 – 2026 (USD Billion)
      Table 22 Latin America 3D Machine Vision Market, by Country, 2016 – 2026 (USD Billion)
      Table 23 Latin America 3D Machine Vision Market, by Component, 2016 – 2026 (USD Billion)
      Table 24 Latin America 3D Machine Vision Market, by Product Type, 2016 – 2026 (USD Billion)
      Table 25 Latin America 3D Machine Vision Market, by Application, 2016 – 2026 (USD Billion)
      Table 26 Latin America 3D Machine Vision Market, by Industry Vertical, 2016 – 2026 (USD Billion)
      Table 27 The Middle-East and Africa 3D Machine Vision Market, by Country, 2016 – 2026 (USD Billion)
      Table 28 The Middle-East and Africa 3D Machine Vision Market, by Component, 2016 – 2026 (USD Billion)
      Table 29 The Middle-East and Africa 3D Machine Vision Market, by Product Type, 2016 – 2026 (USD Billion)
      Table 30 The Middle-East and Africa 3D Machine Vision Market, by Application, 2016 – 2026 (USD Billion)
      Table 31 The Middle-East and Africa 3D Machine Vision Market, by Industry Vertical, 2016 – 2026 (USD Billion)
      Table 32 Global 3D Machine Vision Market - Company Revenue Analysis, 2016 – 2019 (USD Billion)
      Table 33 Global 3D Machine Vision Market - Company Revenue Share Analysis, 2016 – 2019 (%)
      Table 34 Acquisitions and Mergers
      Table 35 Market Drivers – Impact Analysis
      Table 36 Market Restraints
      Table 37 Market Opportunities
      Table 38 Major Buyers of 3D Machine Vision
      Table 39 Distributors/Traders of 3D Machine Vision by Region
      

Industry Major Market Players

  • OMRON Corporation
  • Keyence Corporation
  • Cognex Corporation
  • Basler AG
  • National Instruments
  • ISRA Vision AG
  • TKH group
  • Stemmer Imaging
  • MVTec Software GmbH
  • Tordivel AS
  • Sick AG
  • LMI Technologies
  • Sony Corporation
  • Teledyne Technologies
  • Canon Inc.
  • Balluff GmBH
  • Industrial Vision System
  • Intel Corporation
  • Robotic Vision Technologies Inc.
  • Coherent Inc.
  • Hermary Opto Electronics INC
  • Baumer Optronic GmbH
  • Texas Instruments Incorporated