Search Market Research Report

Discover Our Latest Reports
Discover Our Featured Reports
Discover Top Selling Reports

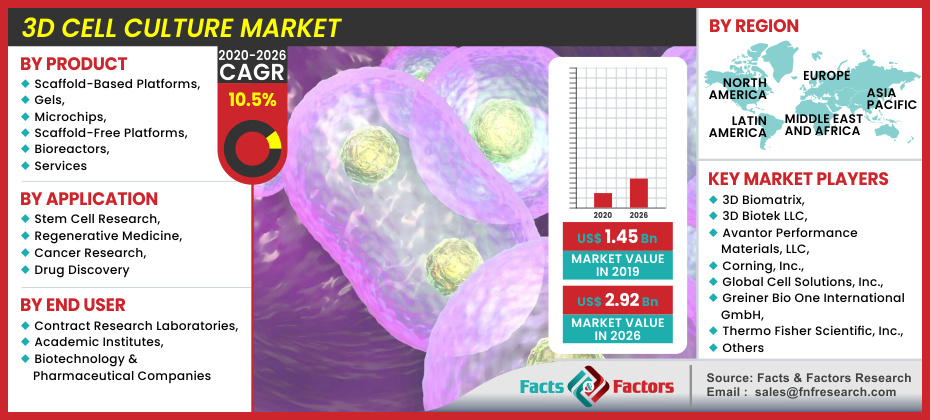
3D Cell Culture Market Size, Share Global Analysis Report, , 2020 – 2026

report img

3D Cell Culture Market By Product (Scaffold-Based Platforms, Gels, Microchips, Scaffold-Free Platforms, Bioreactors, and Services), Application (Stem Cell Research, Regenerative Medicine, Cancer Research, and Drug Discovery), and End User (Contract Research Laboratories, Academic Institutes, and Biotechnology & Pharmaceutical Companies): Global Industry Perspective, Comprehensive Analysis, and Forecast, 2020 – 2026

Industry Insights

[225+ Pages Report] Global 3D Cell Culture Market was projected to be around USD 1.45 Billion in 2019, with sales forecast to hit around USD 2.92 Billion by the end of 2026 to rise by around 10.5% at CAGR by 2020 to 2026.

Global Cell Culture Market Size

To know more about this report | Request Free Sample Copy

logoMarket Overview

A 3D cell culture is an in-vitro technique in which cells mature in a developed artificial environment. These ecosystems closely mimic the original tissue's architecture and structure. 3D cell culture technology aims to facilitate the division, proliferation and migration of the cells by the interaction with their three-dimensional environments. As the shape, activity, and micro atmosphere of the tissue in vivo can be imitated in 3D cell cultures, this technique has a wide range of uses in the field of medicinal screening, regenerative medicine, stem cell treatments, and cancer research, and cell biology. Extracellular matrices in 3D cell cultures permit direct cell-cell communication by cytokines and trophic factors as in the in-vivo environment. In a 2D world, these factors can be altered and can greatly impact cell-cell connectivity, thereby altering cell morphology and proliferation. As the architecture and complex cellular matrices of 3D cultures cannot be recapitulated by 2D culture, this technique is gaining prominence in the health research sector. 3D cell cultures can also deliver efficient outcomes and reduce the total costs of research and development.

logoIndustry Growth Factor

Due to the launch of new medicinal products and the availability of generic biopharmaceuticals or related products produced by various firms, the demand in 3-D cell culture increases. Along with the rapid growth of biofarm products, 3D cell culture over the projected timeframe is expected to experience substantial traction. The demand for biopharmaceutical products with 3D cell culture is expected to revolutionise the industry.

3D Cell Culture Market

To know more about this report | Request Free Sample Copy

Animal testing and research application has brought ethical concerns underlined by organisations for animal rights. In 2019, 115 Billion animals have been used globally for animal experimentation last year, according to The Human Society International. The replacement of animals for laboratory research is expected by 3D cell culture. Government and non-profit bodies, such as the Environmental Protection Agency, the National Toxicology Program and the National Health Institutes initiated the ToxCast project for the replacement of 3D cell culture laboratory animals. These trends and increased visibility build opportunities in the near future to expand 3D cell culture.

Due to factors like use of 3D cell cultivation model as alternatives to in vivo research, automated large-scale cell culture systems production, as well as the increased demand for organ transplantation, the 3D cell culture market is growing steadily. In cell-based screening, 2D monolayer cell cultures were used as an effective means to discover new candidates for medicinal products. 2D cell cultures, however, have shortcomings such as lack of tissue specific architecture, mechanical and biochemical indications, and associations between cell-to-cell and cell-to-matrix, thereby rendering them comparatively weak models for predicting drug reagents for certain diseases.

A 3D cell culture is preferred to a 2D cell culture because it enables cells to expand, as they will in vivo, in any direction. Due to the benefits of 3D cell culture compared to alternative methods, researchers and drug creators have benefited from adoption. Because of these reasons, over the projected period, the market is expected to see steady growth.

logoGlobal 3D Cell Culture Market: Segmentation

Based on product segment the market is further sub segmented into scaffold-based platforms, gels, microchips, scaffold-free platforms, bioreactors, and services. Additionally based on application segment market is further categorized into stem cell research, regenerative medicine, cancer research, and drug discovery. Moreover, based on end user segment the market can be further classified into contract research laboratories, academic institutes, and biotechnology & pharmaceutical companies.

logoCOVID-19 Impact on 3D Cell Culture Market

The pandemic COVID-19 has resulted in national lock-ups, affecting vertically all industries. Also, the pandemic is affecting the 3D cell culture industry. The 3D cell culture industry is facing new difficulties in addressing the demand and availability, due to the COVID-19 pandemic, in 3D cell culture components. Incongruous and disrupted supply chain operations are also likely to have an effect on business development, along with scarcity of human resources. In the other hand, the growth in clinical activities for the development of new COVID- 19 therapies offers main industry players a great opportunity. Research including stem and regenerative treatment has demonstrated successful outcomes for the treatment of COVID-19, thereby compensating for the worldwide deleterious effects of a lockout. The overall effect for COVID 19 in the 3D cell culture industry is therefore expected to remain modest for the leading players.

logoGlobal 3D Cell Culture Market: Regional Analysis

Based on regions, the global 3D cell culture market can be divided into five main regions.

The involvement of many pharmaceutical and biotechnological firms using 3D culture technologies in cooperation with research institutes and clinical laboratories to produce renewable medicines and drug discovery & production, is anticipated for North America to retain its supremacy during the forecast period. In addition, the demands on organ transplantation and the R&D activities are projected to encourage the implementation of 3D-cell culture practices in the field, based on technologically advanced approaches.

Additionally, the rise in cancer incidences prompted the state to increase cancer research and R&D subsidies which may have beneficial effects on the business development of 3D cell culture. In addition, the strategic expansion of biotechnological and pharmaceutical firms has led to the launch of innovative products which will, in the coming years, increase market demand.

logoReport Scope

Report Attribute

Details

Market Size in 2019

USD 1.45 Billion

Projected Market Size in 2026

USD 2.92 Billion

Growth Rate

CAGR 10.5%

Base Year

2019

Forecast Years

2020–2026

Key Market Players

3D Biomatrix, 3D Biotek LLC, Avantor Performance Materials, LLC, Corning, Inc., Global Cell Solutions, Inc., Greiner Bio One International GmbH, Thermo Fisher Scientific, Inc., Merck KGaA, PromoCell GmbH, Tecan Trading AG, Lonza, InSphero, and among others.

Key Segment

By Product, By Region

Major Regions Covered

North America, Europe, Asia Pacific, Latin America, and the Middle East & Africa

Purchase Options

Request customized purchase options to meet your research needs. Explore purchase options

logoGlobal 3D Cell Culture Market: Competitive Players

Some of the key players in the market are

  • 3D Biomatrix
  • 3D Biotek LLC
  • Avantor Performance Materials LLC
  • Corning Inc.
  • Global Cell Solutions Inc.
  • Greiner Bio One International GmbH
  • Thermo Fisher Scientific Inc.
  • Merck KGaA
  • PromoCell GmbH
  • Tecan Trading AG
  • Lonza
  • InSphero
  • and among others.

logoGlobal 3D Cell Culture Market: Regional Segment Analysis

  • North America
    • U.S.
    • Canada
  • Europe
    • U.K.
    • France
    • Germany
  • The Asia Pacific
    • China
    • Japan
    • India
  • Latin America
    • Brazil
    • Mexico
  • The Middle East and Africa

Table of Content

  1. Chapter 1 Executive Summary
    1. 1.1. Introduction of 3D Cell Culture
    2. 1.2. Global 3D Cell Culture Market, 2019 & 2026 (USD Billion)
    3. 1.3. COVID-19 Impacts on 3D Cell Culture Market
      1. 1.3.1. Short Term COVID-19 Impact on the Market
      2. 1.3.2. Mid-Term COVID-19 Impact on the Market
      3. 1.3.3. Long-Term COVID-19 Impact on the Market
    4. 1.4. Business Strategies and Recommendations
    5. 1.5. Global 3D Cell Culture Market, 2016 – 2026 (USD Billion)
    6. 1.6. Global 3D Cell Culture Market Absolute Revenue Opportunity, 2016 – 2026 (USD Billion)
    7. 1.7. Global 3D Cell Culture Market Incremental Revenue Opportunity, 2020 – 2026 (USD Billion)
  2. Chapter 2 3D Cell Culture Market – Product Analysis
    1. 2.1. Global 3D Cell Culture Market – Product Overview
    2. 2.2. Global 3D Cell Culture Market Share, by Product, 2019 & 2026 (USD Billion)
    3. 2.3. Scaffold-Based Platforms
      1. 2.3.1. Global Scaffold-Based Platforms 3D Cell Culture Market, 2016 – 2026 (USD Billion)
    4. 2.4. Gels
      1. 2.4.1. Global Gels 3D Cell Culture Market, 2016 – 2026 (USD Billion)
    5. 2.5. Microchips
      1. 2.5.1. Global Microchips 3D Cell Culture Market, 2016 – 2026 (USD Billion)
    6. 2.6. Scaffold-Free Platforms
      1. 2.6.1. Global Scaffold-Free Platforms 3D Cell Culture Market, 2016 – 2026 (USD Billion)
    7. 2.7. Bioreactors
      1. 2.7.1. Global Bioreactors 3D Cell Culture Market, 2016 – 2026 (USD Billion)
    8. 2.8. Services
      1. 2.8.1. Global Services 3D Cell Culture Market, 2016 – 2026 (USD Billion)
  3. Chapter 3 3D Cell Culture Market – Application Analysis
    1. 3.1. Global 3D Cell Culture Market – Application Overview
    2. 3.2. Global 3D Cell Culture Market Share, by Application, 2019 & 2026 (USD Billion)
    3. 3.3. Stem Cell Research
      1. 3.3.1. Global Stem Cell Research 3D Cell Culture Market, 2016 – 2026 (USD Billion)
    4. 3.4. Regenerative Medicine
      1. 3.4.1. Global Regenerative Medicine 3D Cell Culture Market, 2016 – 2026 (USD Billion)
    5. 3.5. Cancer Research
      1. 3.5.1. Global Cancer Research 3D Cell Culture Market, 2016 – 2026 (USD Billion)
    6. 3.6. Drug Discovery
      1. 3.6.1. Global Drug Discovery 3D Cell Culture Market, 2016 – 2026 (USD Billion)
  4. Chapter 4 3D Cell Culture Market – End User Analysis
    1. 4.1. Global 3D Cell Culture Market – End User Overview
    2. 4.2. Global 3D Cell Culture Market Share, by End User, 2019 & 2026 (USD Billion)
    3. 4.3. Contract Research Laboratories
      1. 4.3.1. Global Contract Research Laboratories 3D Cell Culture Market, 2016 – 2026 (USD Billion)
    4. 4.4. Academic Institutes
      1. 4.4.1. Global Academic Institutes 3D Cell Culture Market, 2016 – 2026 (USD Billion)
    5. 4.5. Biotechnology & Pharmaceutical Companies
      1. 4.5.1. Global Biotechnology & Pharmaceutical Companies 3D Cell Culture Market, 2016 – 2026 (USD Billion)
  5. Chapter 5 3D Cell Culture Market – Regional Analysis
    1. 5.1. Global 3D Cell Culture Market Regional Overview
    2. 5.2. Global 3D Cell Culture Market Share, by Region, 2019 & 2026 (USD Billion)
    3. 5.3. North America
      1. 5.3.1. North America 3D Cell Culture Market, 2016 – 2026 (USD Billion)
      2. 5.3.2. North America 3D Cell Culture Market, by Product, 2016 – 2026
      3. 5.3.3. North America 3D Cell Culture Market, by Application, 2016 – 2026
      4. 5.3.4. North America 3D Cell Culture Market, by End User, 2016 – 2026
      5. 5.3.5. U.S.
      6. 5.3.6. Canada
    4. 5.4. Europe
      1. 5.4.1. Europe 3D Cell Culture Market, 2016 – 2026 (USD Billion)
      2. 5.4.2. Europe 3D Cell Culture Market, by Product, 2016 – 2026
      3. 5.4.3. Europe 3D Cell Culture Market, by Application, 2016 – 2026
      4. 5.4.4. Europe 3D Cell Culture Market, by End User, 2016 – 2026
      5. 5.4.5. Germany
      6. 5.4.6. France
      7. 5.4.7. U.K.
      8. 5.4.8. Italy
      9. 5.4.9. Spain
      10. 5.4.10. Rest of Europe
    5. 5.5. Asia Pacific
      1. 5.5.1. Asia Pacific 3D Cell Culture Market, 2016 – 2026 (USD Billion)
      2. 5.5.2. Asia Pacific 3D Cell Culture Market, by Product, 2016 – 2026
      3. 5.5.3. Asia Pacific 3D Cell Culture Market, by Application, 2016 – 2026
      4. 5.5.4. Asia Pacific 3D Cell Culture Market, by End User, 2016 – 2026
      5. 5.5.5. China
      6. 5.5.6. Japan
      7. 5.5.7. India
      8. 5.5.8. South Korea
      9. 5.5.9. South-East Asia
      10. 5.5.10. Rest of Asia Pacific
    6. 5.6. Latin America
      1. 5.6.1. Latin America 3D Cell Culture Market, 2016 – 2026 (USD Billion)
      2. 5.6.2. Latin America 3D Cell Culture Market, by Product, 2016 – 2026
      3. 5.6.3. Latin America 3D Cell Culture Market, by Application, 2016 – 2026
      4. 5.6.4. Latin America 3D Cell Culture Market, by End User, 2016 – 2026
      5. 5.6.5. Brazil
      6. 5.6.6. Mexico
      7. 5.6.7. Rest of Latin America
    7. 5.7. The Middle-East and Africa
      1. 5.7.1. The Middle-East and Africa 3D Cell Culture Market, 2016 – 2026 (USD Billion)
      2. 5.7.2. The Middle-East and Africa 3D Cell Culture Market, by Product, 2016 – 2026
      3. 5.7.3. The Middle-East and Africa 3D Cell Culture Market, by Application, 2016 – 2026
      4. 5.7.4. The Middle-East and Africa 3D Cell Culture Market, by End User, 2016 – 2026
      5. 5.7.5. GCC Countries
      6. 5.7.6. South Africa
      7. 5.7.7. Rest of Middle-East Africa
  6. Chapter 6 3D Cell Culture Market – Competitive Landscape
    1. 6.1. Competitor Market Share – Revenue
    2. 6.2. Market Concentration Rate Analysis, Top 3 and Top 5 Players
    3. 6.3. Strategic Developments
      1. 6.3.1. Acquisitions and Mergers
      2. 6.3.2. New Products
      3. 6.3.3. Research & Development Activities
  7. Chapter 7 Company Profiles
    1. 7.1. 3D Biomatrix
      1. 7.1.1. Company Overview
      2. 7.1.2. Product/Service Portfolio
      3. 7.1.3. 3D Biomatrix Sales, Revenue, and Gross Margin
      4. 7.1.4. 3D Biomatrix Revenue and Growth Rate
      5. 7.1.5. 3D Biomatrix Market Share
      6. 7.1.6. Recent Initiatives, Funding/VC Activities, and Technological Innovations
    2. 7.2. 3D Biotek LLC
      1. 7.2.1. Company Overview
      2. 7.2.2. Product/Service Portfolio
      3. 7.2.3. 3D Biotek LLC Sales, Revenue, and Gross Margin
      4. 7.2.4. 3D Biotek LLC Revenue and Growth Rate
      5. 7.2.5. 3D Biotek LLC Market Share
      6. 7.2.6. Recent Initiatives, Funding/VC Activities, and Technological Innovations
    3. 7.3. Avantor Performance Materials, LLC
      1. 7.3.1. Company Overview
      2. 7.3.2. Product/Service Portfolio
      3. 7.3.3. Avantor Performance Materials, LLC Sales, Revenue, and Gross Margin
      4. 7.3.4. Avantor Performance Materials, LLC Revenue and Growth Rate
      5. 7.3.5. Avantor Performance Materials, LLC Market Share
      6. 7.3.6. Recent Initiatives, Funding/VC Activities, and Technological Innovations
    4. 7.4. Corning, Inc.
      1. 7.4.1. Company Overview
      2. 7.4.2. Product/Service Portfolio
      3. 7.4.3. Corning, Inc. Sales, Revenue, and Gross Margin
      4. 7.4.4. Corning, Inc. Revenue and Growth Rate
      5. 7.4.5. Corning, Inc. Market Share
      6. 7.4.6. Recent Initiatives, Funding/VC Activities, and Technological Innovations
    5. 7.5. Global Cell Solutions, Inc.
      1. 7.5.1. Company Overview
      2. 7.5.2. Product/Service Portfolio
      3. 7.5.3. Global Cell Solutions, Inc. Sales, Revenue, and Gross Margin
      4. 7.5.4. Global Cell Solutions, Inc. Revenue and Growth Rate
      5. 7.5.5. Global Cell Solutions, Inc. Market Share
      6. 7.5.6. Recent Initiatives, Funding/VC Activities, and Technological Innovations
    6. 7.6. Greiner Bio One International GmbH
      1. 7.6.1. Company Overview
      2. 7.6.2. Product/Service Portfolio
      3. 7.6.3. Greiner Bio One International GmbH Sales, Revenue, and Gross Margin
      4. 7.6.4. Greiner Bio One International GmbH Revenue and Growth Rate
      5. 7.6.5. Greiner Bio One International GmbH Market Share
      6. 7.6.6. Recent Initiatives, Funding/VC Activities, and Technological Innovations
    7. 7.7. Thermo Fisher Scientific, Inc.
      1. 7.7.1. Company Overview
      2. 7.7.2. Product/Service Portfolio
      3. 7.7.3. Thermo Fisher Scientific, Inc. Sales, Revenue, and Gross Margin
      4. 7.7.4. Thermo Fisher Scientific, Inc. Revenue and Growth Rate
      5. 7.7.5. Thermo Fisher Scientific, Inc. Market Share
      6. 7.7.6. Recent Initiatives, Funding/VC Activities, and Technological Innovations
    8. 7.8. Merck KGaA
      1. 7.8.1. Company Overview
      2. 7.8.2. Product/Service Portfolio
      3. 7.8.3. Merck KGaA Sales, Revenue, and Gross Margin
      4. 7.8.4. Merck KGaA Revenue and Growth Rate
      5. 7.8.5. Merck KGaA Market Share
      6. 7.8.6. Recent Initiatives, Funding/VC Activities, and Technological Innovations
    9. 7.9. PromoCell GmbH
      1. 7.9.1. Company Overview
      2. 7.9.2. Product/Service Portfolio
      3. 7.9.3. PromoCell GmbH Sales, Revenue, and Gross Margin
      4. 7.9.4. PromoCell GmbH Revenue and Growth Rate
      5. 7.9.5. PromoCell GmbH Market Share
      6. 7.9.6. Recent Initiatives, Funding/VC Activities, and Technological Innovations
    10. 7.10. Tecan Trading AG
      1. 7.10.1. Company Overview
      2. 7.10.2. Product/Service Portfolio
      3. 7.10.3. Tecan Trading AG Sales, Revenue, and Gross Margin
      4. 7.10.4. Tecan Trading AG Revenue and Growth Rate
      5. 7.10.5. Tecan Trading AG Market Share
      6. 7.10.6. Recent Initiatives, Funding/VC Activities, and Technological Innovations
    11. 7.11. Lonza
      1. 7.11.1. Company Overview
      2. 7.11.2. Product/Service Portfolio
      3. 7.11.3. Lonza Sales, Revenue, and Gross Margin
      4. 7.11.4. Lonza Revenue and Growth Rate
      5. 7.11.5. Lonza Market Share
      6. 7.11.6. Recent Initiatives, Funding/VC Activities, and Technological Innovations
    12. 7.12. InSphero
      1. 7.12.1. Company Overview
      2. 7.12.2. Product/Service Portfolio
      3. 7.12.3. InSphero Sales, Revenue, and Gross Margin
      4. 7.12.4. InSphero Revenue and Growth Rate
      5. 7.12.5. InSphero Market Share
      6. 7.12.6. Recent Initiatives, Funding/VC Activities, and Technological Innovations
  8. Chapter 8 3D Cell Culture — Industry Analysis
    1. 8.1. Introduction and Taxonomy
    2. 8.2. 3D Cell Culture Market – Key Trends
      1. 8.2.1. Market Drivers
      2. 8.2.2. Market Restraints
      3. 8.2.3. Market Opportunities
    3. 8.3. Value Chain Analysis
    4. 8.4. Key Mandates and Regulations
    5. 8.5. Technology Roadmap and Timeline
    6. 8.6. 3D Cell Culture Market – Attractiveness Analysis
      1. 8.6.1. By Product
      2. 8.6.2. By Application
      3. 8.6.3. By End User
      4. 8.6.4. By Region
  9. Chapter 9 Industrial Chain, Sourcing Strategy, and Downstream Buyers
    1. 9.1. 3D Cell Culture Industrial Chain Analysis
    2. 9.2. Downstream Buyers
    3. 9.3. Distributors/Traders List
  10. Chapter 10 Marketing Strategy Analysis
    1. 10.1. Marketing Channel
    2. 10.2. Direct Marketing
    3. 10.3. Indirect Marketing
    4. 10.4. Marketing Channel Development Trends
    5. 10.5. Economic/Political Environmental Change
  11. Chapter 11 Report Conclusion & Key Insights
    1. 11.1. Key Insights from Primary Interviews & Surveys Respondents
    2. 11.2. Key Takeaways from Analysts, Consultants, and Industry Leaders
  12. Chapter 12 Research Approach & Methodology
    1. 12.1. Report Description
    2. 12.2. Research Scope
    3. 12.3. Research Methodology
      1. 12.3.1. Secondary Research
      2. 12.3.2. Primary Research
      3. 12.3.3. Statistical Models
      4. 12.3.4. Research Limitations

      List of Figures

      Fig.1	Product Picture of 3D Cell Culture
      Fig.2	COVID-19 Impacts on 3D Cell Culture Market
      Fig.3	Business Strategies and Recommendations
      Fig.4	Global 3D Cell Culture Market, 2016 – 2026 (USD Billion)
      Fig.5	Global 3D Cell Culture Market Absolute Revenue Opportunity, 2016 – 2026 (USD Billion)
      Fig.6	Global 3D Cell Culture Market Incremental Revenue Opportunity, 2020 – 2026 (USD Billion)
      Fig.7	Global 3D Cell Culture Market Share, by Product, 2019 & 2026 (USD Billion)
      Fig.8	Global Scaffold-Based Platforms 3D Cell Culture Market, 2016 – 2026 (USD Billion)
      Fig.9	Global Gels 3D Cell Culture Market, 2016 – 2026 (USD Billion)
      Fig.10	Global Microchips 3D Cell Culture Market, 2016 – 2026 (USD Billion)
      Fig.11	Global Scaffold-Free Platforms 3D Cell Culture Market, 2016 – 2026 (USD Billion)
      Fig.12	Global Bioreactors 3D Cell Culture Market, 2016 – 2026 (USD Billion)
      Fig.13	Global Services 3D Cell Culture Market, 2016 – 2026 (USD Billion)
      Fig.14	Global 3D Cell Culture Market Share, by Application, 2019 & 2026 (USD Billion)
      Fig.15	Global Stem Cell Research 3D Cell Culture Market, 2016 – 2026 (USD Billion)
      Fig.16	Global Regenerative Medicine 3D Cell Culture Market, 2016 – 2026 (USD Billion)
      Fig.17	Global Cancer Research 3D Cell Culture Market, 2016 – 2026 (USD Billion)
      Fig.18	Global Drug Discovery 3D Cell Culture Market, 2016 – 2026 (USD Billion)
      Fig.19	Global 3D Cell Culture Market Share, by End User, 2019 & 2026 (USD Billion)
      Fig.20	Global Contract Research Laboratories 3D Cell Culture Market, 2016 – 2026 (USD Billion)
      Fig.21	Global Academic Institutes 3D Cell Culture Market, 2016 – 2026 (USD Billion)
      Fig.22	Global Biotechnology & Pharmaceutical Companies 3D Cell Culture Market, 2016 – 2026 (USD Billion)
      Fig.23	Global 3D Cell Culture Market Share, by Region, 2019 & 2026 (USD Billion)
      Fig.24	North America 3D Cell Culture Market, 2016 – 2026 (USD Billion)
      Fig.25	U.S. 3D Cell Culture Market, 2016 – 2026 (USD Billion)
      Fig.26	Canada 3D Cell Culture Market, 2016 – 2026 (USD Billion)
      Fig.27	Europe 3D Cell Culture Market, 2016 – 2026 (USD Billion)
      Fig.28	Germany 3D Cell Culture Market, 2016 – 2026 (USD Billion)
      Fig.29	France 3D Cell Culture Market, 2016 – 2026 (USD Billion)
      Fig.30	U.K. 3D Cell Culture Market, 2016 – 2026 (USD Billion)
      Fig.31	Italy 3D Cell Culture Market, 2016 – 2026 (USD Billion)
      Fig.32	Spain 3D Cell Culture Market, 2016 – 2026 (USD Billion)
      Fig.33	Rest of Europe 3D Cell Culture Market, 2016 – 2026 (USD Billion)
      Fig.34	Asia Pacific 3D Cell Culture Market, 2016 – 2026 (USD Billion)
      Fig.35	China 3D Cell Culture Market, 2016 – 2026 (USD Billion)
      Fig.36	Japan 3D Cell Culture Market, 2016 – 2026 (USD Billion)
      Fig.37	India 3D Cell Culture Market, 2016 – 2026 (USD Billion)
      Fig.38	South Korea 3D Cell Culture Market, 2016 – 2026 (USD Billion)
      Fig.39	South-East Asia 3D Cell Culture Market, 2016 – 2026 (USD Billion)
      Fig.40	Rest of Asia Pacific 3D Cell Culture Market, 2016 – 2026 (USD Billion)
      Fig.41	Latin America 3D Cell Culture Market, 2016 – 2026 (USD Billion)
      Fig.42	Brazil 3D Cell Culture Market, 2016 – 2026 (USD Billion)
      Fig.43	Mexico 3D Cell Culture Market, 2016 – 2026 (USD Billion)
      Fig.44	Rest of Latin America 3D Cell Culture Market, 2016 – 2026 (USD Billion)
      Fig.45	The Middle-East and Africa 3D Cell Culture Market, 2016 – 2026 (USD Billion)
      Fig.46	GCC Countries 3D Cell Culture Market, 2016 – 2026 (USD Billion)
      Fig.47	South Africa 3D Cell Culture Market, 2016 – 2026 (USD Billion)
      Fig.48	Rest of Middle-East Africa 3D Cell Culture Market, 2016 – 2026 (USD Billion)
      Fig.49	Competitor Market Share – Revenue
      Fig.50	3D Biomatrix Revenue and Growth Rate
      Fig.51	3D Biomatrix Market Share
      Fig.52	3D Biotek LLC Revenue and Growth Rate
      Fig.53	3D Biotek LLC Market Share
      Fig.54	Avantor Performance Materials, LLC Revenue and Growth Rate
      Fig.55	Avantor Performance Materials, LLC Market Share
      Fig.56	Corning, Inc. Revenue and Growth Rate
      Fig.57	Corning, Inc. Market Share
      Fig.58	Global Cell Solutions, Inc. Revenue and Growth Rate
      Fig.59	Global Cell Solutions, Inc. Market Share
      Fig.60	Greiner Bio One International GmbH Revenue and Growth Rate
      Fig.61	Greiner Bio One International GmbH Market Share
      Fig.62	Thermo Fisher Scientific, Inc. Revenue and Growth Rate
      Fig.63	Thermo Fisher Scientific, Inc. Market Share
      Fig.64	Merck KGaA Revenue and Growth Rate
      Fig.65	Merck KGaA Market Share
      Fig.66	PromoCell GmbH Revenue and Growth Rate
      Fig.67	PromoCell GmbH Market Share
      Fig.68	Tecan Trading AG Revenue and Growth Rate
      Fig.69	Tecan Trading AG Market Share
      Fig.70	Lonza Revenue and Growth Rate
      Fig.71	Lonza Market Share
      Fig.72	InSphero Revenue and Growth Rate
      Fig.73	InSphero Market Share
      Fig.74	Market Dynamics
      Fig.75	Global 3D Cell Culture – Value Chain Analysis
      Fig.76	Key Mandates and Regulations
      Fig.77	Technology Roadmap and Timeline
      Fig.78	Market Attractiveness Analysis – By Product
      Fig.79	Market Attractiveness Analysis – By Application
      Fig.80	Market Attractiveness Analysis – By End User
      Fig.81	Market Attractiveness Analysis – By Region
      Fig.82	3D Cell Culture Industrial Chain Analysis
      Fig.83	Market Channels
      Fig.84	Marketing Channel Development Trend
      Fig.85	Growth in World Gross Product, 2008-2018
      

      List of Tables

      Table 1	Global 3D Cell Culture Market, 2019 & 2026 (USD Billion)
      Table 2	Global 3D Cell Culture Market, by Product, 2016 – 2026 (USD Billion)
      Table 3	Global 3D Cell Culture Market, by Application, 2016 – 2026 (USD Billion)
      Table 4	Global 3D Cell Culture Market, by End User, 2016 – 2026 (USD Billion)
      Table 5	Global 3D Cell Culture Market, by Region, 2016 – 2026 (USD Billion)
      Table 6	North America 3D Cell Culture Market, by Country, 2016 – 2026 (USD Billion)
      Table 7	North America 3D Cell Culture Market, by Product, 2016 – 2026 (USD Billion)
      Table 8	North America 3D Cell Culture Market, by Application, 2016 – 2026 (USD Billion)
      Table 9	North America 3D Cell Culture Market, by End User, 2016 – 2026 (USD Billion)
      Table 10 Europe 3D Cell Culture Market, by Country, 2016 – 2026 (USD Billion)
      Table 11 Europe 3D Cell Culture Market, by Product, 2016 – 2026 (USD Billion)
      Table 12 Europe 3D Cell Culture Market, by Application, 2016 – 2026 (USD Billion)
      Table 13 Europe 3D Cell Culture Market, by End User, 2016 – 2026 (USD Billion)
      Table 14 Asia Pacific 3D Cell Culture Market, by Country, 2016 – 2026 (USD Billion)
      Table 15 Asia Pacific 3D Cell Culture Market, by Product, 2016 – 2026 (USD Billion)
      Table 16 Asia Pacific 3D Cell Culture Market, by Application, 2016 – 2026 (USD Billion)
      Table 17 Asia Pacific 3D Cell Culture Market, by End User, 2016 – 2026 (USD Billion)
      Table 18 Latin America 3D Cell Culture Market, by Country, 2016 – 2026 (USD Billion)
      Table 19 Latin America 3D Cell Culture Market, by Product, 2016 – 2026 (USD Billion)
      Table 20 Latin America 3D Cell Culture Market, by Application, 2016 – 2026 (USD Billion)
      Table 21 Latin America 3D Cell Culture Market, by End User, 2016 – 2026 (USD Billion)
      Table 22 The Middle-East and Africa 3D Cell Culture Market, by Country, 2016 – 2026 (USD Billion)
      Table 23 The Middle-East and Africa 3D Cell Culture Market, by Product, 2016 – 2026 (USD Billion)
      Table 24 The Middle-East and Africa 3D Cell Culture Market, by Application, 2016 – 2026 (USD Billion)
      Table 25 The Middle-East and Africa 3D Cell Culture Market, by End User, 2016 – 2026 (USD Billion)
      Table 26 Global 3D Cell Culture Market - Company Revenue Analysis, 2016 – 2019 (USD Billion)
      Table 27 Global 3D Cell Culture Market - Company Revenue Share Analysis, 2016 – 2019 (%)
      Table 28 Acquisitions and Mergers
      Table 29 Market Drivers – Impact Analysis
      Table 30 Market Restraints
      Table 31 Market Opportunities
      Table 32 Major Buyers of 3D Cell Culture
      Table 33 Distributors/Traders of 3D Cell Culture by Region
      

Industry Major Market Players

  • 3D Biomatrix
  • 3D Biotek LLC
  • Avantor Performance Materials
  • LLC
  • Corning Inc.
  • Global Cell Solutions Inc.
  • Greiner Bio One International GmbH
  • Thermo Fisher Scientific Inc.
  • Merck KGaA, PromoCell GmbH
  • Tecan Trading AG
  • Lonza
  • InSphero