Search Market Research Report

Discover Our Latest Reports
Discover Our Featured Reports
Discover Top Selling Reports

3D CAD Market Size, Share Global Analysis Report, 2021 – 2026

report img

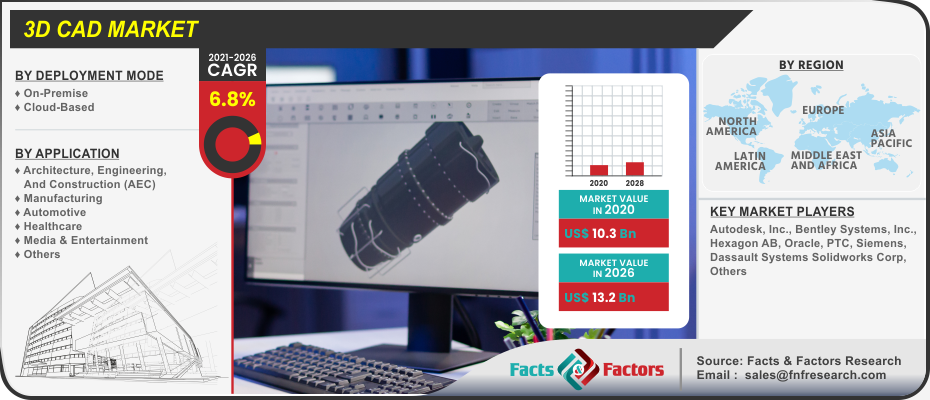
3D CAD Market By Deployment Mode (On Premise & Cloud Based), By Application (Architecture, Engineering, And Construction (AEC), Manufacturing, Automotive, Healthcare, Media & Entertainment, & Others), And By Regions - Global & Regional Industry Perspective, Comprehensive Analysis, and Forecast 2021 – 2026

Industry Insights

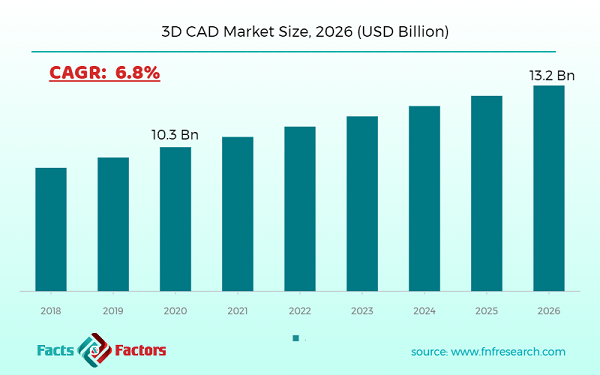
[197+ Pages Report] The latest findings and offers on the 3D CAD market released by Facts & Factors encompass the current market statistics and analysis. We at Facts & Factors estimated that the global 3D CAD market valued USD 10.3 Billion in the year 2020 and will grow at a CAGR of 6.8% to an overall value of USD 13.2 Billion by 2026.

logoMarket Overview

3D CAD or 3D CAD software is a computer-simulated technology that is often used for aiding in a wide variety of technical and design processes while replacing manual drafting tools with an automated and hassle-free process. These software solutions help in visualizing objects using a collection of objects on a three-dimensional space and further simulate these designs by performing in the same manner as they will in real life.

3D CAD Market Size

To know more about this report | Request Free Sample Copy

logoIndustry Growth Factors

The driving forces for the primary 3D CAD market include the integration of 3D CAD software in the manufacturing sector coupled with the emergence of a cloud-based platform for 3D CAD software aimed at increasing streamlining processes and design flexibility to name a few. Additionally, the integration of SaaS services offered by CAD software tools coupled with the rising focus of the technology on designing, wrapping, boxing, and bottling consumer goods is expected to increase the footprint of the global 3D CAD market during the advent of the forecast period. Moreover, rising demands for precise designing, digitalization, and complex prototyping in various sectors such as automotive, manufacturing, and aerospace are expected to boost the growth of the global 3D CAD market during the forecast period.

The global 3D CAD market is expected to be driven by the integration of advanced technologies such as AI coupled with rising technological-based adoptions in the automotive industry to name a few. Growing demand for customized and personalized solutions by consumers coupled with increasing demand for 3D printing measures is expected to boost the growth of the global 3D CAD market during the advent of the forecast period. However, rising technical complexities coupled with the rising initial cost are expected to decrease the market share for the global 3D CAD market during the advent of the forecast period.

3D CAD Market

To know more about this report | Request Free Sample Copy

logoSegmentation Analysis

The global 3D CAD market is segmented into deployment mode, application, and regions.

The global 3D CAD market is divided into on-premise and cloud based on the basis of deployment mode. The segment pertaining to on-premise deployment is expected to witness the largest market share during the advent of the forecast owing to the convenient application of solutions for large-scale issues coupled with rising demand from medical, healthcare, and government institutions to name a few. Additionally, factors such as higher flow of information and rising number of data security attributes are expected to cement the growth of the latter segment to a higher market share during the advent of the forecast period. Based on application, the global 3D CAD market is classified into architecture, engineering, and construction (AEC), manufacturing, automotive, healthcare, media & entertainment, and others. The manufacturing segment is expected to witness the largest market share during the advent of the forecast owing to the rising usage by OEMs for simulating moving parts in the manufacturing sector coupled with the rising demand for intricate production of parts to name a few. The segment pertaining to healthcare is expected to witness the fastest growing CAGR during the advent of the forecast period owing to increased functionality of 3D CAD for creating models from data obtained from imaging software coupled with the integration of the latter into surgeries and implantation processes to name a few.


logoKey Insights from Primary Research

  • As per our primary respondents, the global 3D CAD is set to grow annually at a rate of around 6.8%.
  • Further, as per the primary interviews conducted by our team, the deployment of solutions using cloud-based architecture is one of the major factors expected to propel the market in the forecast period
  • Autodesk, Dassault Systems, and Siemens PLM Software are the leading players in the industry
  • It was established through primary research that the 3D CAD market was valued at around USD 10.3 Billion in 2020
  • Presently, most of the vendors are providing the on-premise type of 3D CAD solutions. However, all of them are intending to shift to cloud-based architecture in the coming years.

logoKey Recommendations from Analysts

  • As per our analysts, the 3D CAD market is anticipated to be valued at USD 13.2 Billion in 2026
  • Increasing investments in 3D printing technology and growing cloud-based 3D CAD solutions are the key factors propelling the growth of the market
  • Automotive and aerospace and defense are the two major application segments of this market. In total, these two sectors are contributing to around 55% of the market share.
  • The strategic and competitive advantage provided by the deployment of 3D CAD is anticipated to be the key factor driving this market globally
  • In recent years, cloud-based solutions are growing rapidly, and these types of solutions are replacing the on-premise type of solutions. The cloud-based solutions segment is expected to grow with a significant CAGR compared to the on-premise type of solutions

logo Report Scope

Report Attribute

Details

Market Size in 2020

USD 10.3 Billion

Projected Market Size in 2026

USD 13.2 Billion

CAGR Growth Rate

6.8% CAGR

Base Year

2020

Forecast Years

2021-2026

Key Market Players

Autodesk, Inc., Bentley Systems, Inc., Hexagon AB, Oracle, PTC, Siemens, Dassault Systems Solidworks Corp, and Others

Key Segments

Deployment Mode, Applications, and Region

Major Regions Covered

North America, Europe, Asia Pacific, Latin America, and Middle East & Africa

Purchase Options

Request customized purchase options to meet your research needs. Explore purchase options

logo Regional Analysis

North America is expected to witness the largest market share during the advent of the forecast owing to favorable government policies for integrated deployment of 3D CAD software coupled with a well-established manufacturing sector in the region to name a few. Additionally, a rising presence of key market players in the region coupled with increasing digitalization measures is expected to increase the footprint of the 3D CAD market during the advent of the forecast period. The region of Asia-Pacific is expected to witness the fastest growing CAGR during the advent of the forecast owing to the rising number of AEC and manufacturing regions coupled with the integration of designing and modeling tools to name a few. Moreover, rising demand for 3D CAD software can be expected from the sectors of advanced graphic movies, e-sports, and oil & gas is expected to further cement the dominant market position of the region in terms of a global purview.

logoThe key market participants for the global 3D CAD market

  • Autodesk Inc.
  • Bentley Systems Inc.
  • Hexagon AB
  • Oracle
  • PTC
  • Siemens
  • Dassault Systems Solidworks Corp
  • Schott Syteme GmbH
  • ZWSOFT Co. Ltd.
  • Aveva Group plc.

logo By Deployment Mode Segment Analysis

  • On-Premise
  • Cloud-Based

logo By Application Segment Analysis

  • Architecture, Engineering, And Construction (AEC)
  • Manufacturing
  • Automotive
  • Healthcare
  • Media & Entertainment
  • Others

logo By Regional Segment Analysis

  • North America
    • U.S.
    • Canada
  • Europe
    • UK
    • France
    • Germany
    • Italy
    • Spain
    • Rest of Europe
  • Asia Pacific
    • China
    • Japan
    • India
    • South Korea
    • Southeast Asia
    • Rest of Asia Pacific
  • Latin America
    • Brazil
    • Mexico
    • Rest of Latin America
  • Middle East and Africa
    • GCC Countries
    • South Africa
    • Rest of MEA

Table of Content

  1. Chapter 1 Executive Summary
    1. 1.1. Introduction of 3D CAD
    2. 1.2. Global 3D CAD Market, 2019 & 2026 (USD Billion)
    3. 1.3. Global 3D CAD Market, 2016 – 2026 (USD Billion)
    4. 1.4. Global 3D CAD Market Absolute Revenue Opportunity, 2016 – 2026 (USD Billion)
    5. 1.5. Global 3D CAD Market Incremental Revenue Opportunity, 2020 – 2026 (USD Billion)
  2. Chapter 2 3D CAD Market – Deployment Mode Analysis
    1. 2.1. Global 3D CAD Market – Deployment Mode Overview
    2. 2.2. Global 3D CAD Market Share, by Deployment Mode, 2019 & 2026 (USD Billion)
    3. 2.3. On Premise
      1. 2.3.1. Global On Premise 3D CAD Market, 2016 – 2026 (USD Billion)
    4. 2.4. Cloud Based
      1. 2.4.1. Global Cloud Based 3D CAD Market, 2016 – 2026 (USD Billion)
  3. Chapter 3 3D CAD Market – Application Analysis
    1. 3.1. Global 3D CAD Market – Application Overview
    2. 3.2. Global 3D CAD Market Share, by Application, 2019 & 2026 (USD Billion)
    3. 3.3. Architecture, Engineering, And Construction (AEC)
      1. 3.3.1. Global Architecture, Engineering, And Construction (AEC) 3D CAD Market, 2016 – 2026 (USD Billion)
    4. 3.4. Manufacturing
      1. 3.4.1. Global Manufacturing 3D CAD Market, 2016 – 2026 (USD Billion)
    5. 3.5. Automotive
      1. 3.5.1. Global Automotive 3D CAD Market, 2016 – 2026 (USD Billion)
    6. 3.6. Healthcare
      1. 3.6.1. Global Healthcare 3D CAD Market, 2016 – 2026 (USD Billion)
    7. 3.7. Media & Entertainment
      1. 3.7.1. Global Media & Entertainment 3D CAD Market, 2016 – 2026 (USD Billion)
    8. 3.8. Others
      1. 3.8.1. Global Others 3D CAD Market, 2016 – 2026 (USD Billion)
  4. Chapter 4 3D CAD Market – Regional Analysis
    1. 4.1. Global 3D CAD Market Regional Overview
    2. 4.2. Global 3D CAD Market Share, by Region, 2019 & 2026 (USD Billion)
    3. 4.3. North America
      1. 4.3.1. North America 3D CAD Market, 2016 – 2026 (USD Billion)
        1. 4.3.1.1. North America 3D CAD Market, by Country, 2016 - 2026 (USD Billion)
      2. 4.3.2. North America 3D CAD Market, by Deployment Mode, 2016 – 2026
        1. 4.3.2.1. North America 3D CAD Market, by Deployment Mode, 2016 – 2026 (USD Billion)
      3. 4.3.3. North America 3D CAD Market, by Application, 2016 – 2026
        1. 4.3.3.1. North America 3D CAD Market, by Application, 2016 – 2026 (USD Billion)
      4. 4.3.4. U.S.
        1. 4.3.4.1. U.S. 3D CAD Market, 2016 – 2026 (USD Billion)
      5. 4.3.5. Canada
        1. 4.3.5.1. Canada 3D CAD Market, 2016 – 2026 (USD Billion)
    4. 4.4. Europe
      1. 4.4.1. Europe 3D CAD Market, 2016 – 2026 (USD Billion)
        1. 4.4.1.1. Europe 3D CAD Market, by Country, 2016 - 2026 (USD Billion)
      2. 4.4.2. Europe 3D CAD Market, by Deployment Mode, 2016 – 2026
        1. 4.4.2.1. Europe 3D CAD Market, by Deployment Mode, 2016 – 2026 (USD Billion)
      3. 4.4.3. Europe 3D CAD Market, by Application, 2016 – 2026
        1. 4.4.3.1. Europe 3D CAD Market, by Application, 2016 – 2026 (USD Billion)
      4. 4.4.4. Germany
        1. 4.4.4.1. Germany 3D CAD Market, 2016 – 2026 (USD Billion)
      5. 4.4.5. France
        1. 4.4.5.1. France 3D CAD Market, 2016 – 2026 (USD Billion)
      6. 4.4.6. U.K.
        1. 4.4.6.1. U.K. 3D CAD Market, 2016 – 2026 (USD Billion)
      7. 4.4.7. Italy
        1. 4.4.7.1. Italy 3D CAD Market, 2016 – 2026 (USD Billion)
      8. 4.4.8. Spain
        1. 4.4.8.1. Spain 3D CAD Market, 2016 – 2026 (USD Billion)
      9. 4.4.9. Rest of Europe
        1. 4.4.9.1. Rest of Europe 3D CAD Market, 2016 – 2026 (USD Billion)
    5. 4.5. Asia Pacific
      1. 4.5.1. Asia Pacific 3D CAD Market, 2016 – 2026 (USD Billion)
        1. 4.5.1.1. Asia Pacific 3D CAD Market, by Country, 2016 - 2026 (USD Billion)
      2. 4.5.2. Asia Pacific 3D CAD Market, by Deployment Mode, 2016 – 2026
        1. 4.5.2.1. Asia Pacific 3D CAD Market, by Deployment Mode, 2016 – 2026 (USD Billion)
      3. 4.5.3. Asia Pacific 3D CAD Market, by Application, 2016 – 2026
        1. 4.5.3.1. Asia Pacific 3D CAD Market, by Application, 2016 – 2026 (USD Billion)
      4. 4.5.4. China
        1. 4.5.4.1. China 3D CAD Market, 2016 – 2026 (USD Billion)
      5. 4.5.5. Japan
        1. 4.5.5.1. Japan 3D CAD Market, 2016 – 2026 (USD Billion)
      6. 4.5.6. India
        1. 4.5.6.1. India 3D CAD Market, 2016 – 2026 (USD Billion)
      7. 4.5.7. South Korea
        1. 4.5.7.1. South Korea 3D CAD Market, 2016 – 2026 (USD Billion)
      8. 4.5.8. South-East Asia
        1. 4.5.8.1. South-East Asia 3D CAD Market, 2016 – 2026 (USD Billion)
      9. 4.5.9. Rest of Asia Pacific
        1. 4.5.9.1. Rest of Asia Pacific 3D CAD Market, 2016 – 2026 (USD Billion)
    6. 4.6. Latin America
      1. 4.6.1. Latin America 3D CAD Market, 2016 – 2026 (USD Billion)
        1. 4.6.1.1. Latin America 3D CAD Market, by Country, 2016 - 2026 (USD Billion)
      2. 4.6.2. Latin America 3D CAD Market, by Deployment Mode, 2016 – 2026
        1. 4.6.2.1. Latin America 3D CAD Market, by Deployment Mode, 2016 – 2026 (USD Billion)
      3. 4.6.3. Latin America 3D CAD Market, by Application, 2016 – 2026
        1. 4.6.3.1. Latin America 3D CAD Market, by Application, 2016 – 2026 (USD Billion)
      4. 4.6.4. Brazil
        1. 4.6.4.1. Brazil 3D CAD Market, 2016 – 2026 (USD Billion)
      5. 4.6.5. Mexico
        1. 4.6.5.1. Mexico 3D CAD Market, 2016 – 2026 (USD Billion)
      6. 4.6.6. Rest of Latin America
        1. 4.6.6.1. Rest of Latin America 3D CAD Market, 2016 – 2026 (USD Billion)
    7. 4.7. The Middle-East and Africa
      1. 4.7.1. The Middle-East and Africa 3D CAD Market, 2016 – 2026 (USD Billion)
        1. 4.7.1.1. The Middle-East and Africa 3D CAD Market, by Country, 2016 - 2026 (USD Billion)
      2. 4.7.2. The Middle-East and Africa 3D CAD Market, by Deployment Mode, 2016 – 2026
        1. 4.7.2.1. The Middle-East and Africa 3D CAD Market, by Deployment Mode, 2016 – 2026 (USD Billion)
      3. 4.7.3. The Middle-East and Africa 3D CAD Market, by Application, 2016 – 2026
        1. 4.7.3.1. The Middle-East and Africa 3D CAD Market, by Application, 2016 – 2026 (USD Billion)
      4. 4.7.4. GCC Countries
        1. 4.7.4.1. GCC Countries 3D CAD Market, 2016 – 2026 (USD Billion)
      5. 4.7.5. South Africa
        1. 4.7.5.1. South Africa 3D CAD Market, 2016 – 2026 (USD Billion)
      6. 4.7.6. Rest of Middle-East Africa
        1. 4.7.6.1. Rest of Middle-East Africa 3D CAD Market, 2016 – 2026 (USD Billion)
  5. Chapter 5 3D CAD Market – Competitive Landscape
    1. 5.1. Competitor Market Share – Revenue
    2. 5.2. Market Concentration Rate Analysis, Top 3 and Top 5 Players
    3. 5.3. Strategic Developments
      1. 5.3.1. Acquisitions and Mergers
      2. 5.3.2. New Products
      3. 5.3.3. Research & Development Activities
  6. Chapter 6 Company Profiles
    1. 6.1. Autodesk Inc
      1. 6.1.1. Company Overview
      2. 6.1.2. Product/Service Portfolio
      3. 6.1.3. Autodesk Inc Sales, Revenue, and Gross Margin
      4. 6.1.4. Autodesk Inc Revenue and Growth Rate
      5. 6.1.5. Autodesk Inc Market Share
      6. 6.1.6. Recent Initiatives, Funding/VC Activities, and Technological Innovations
    2. 6.2. Bentley Systems Inc
      1. 6.2.1. Company Overview
      2. 6.2.2. Product/Service Portfolio
      3. 6.2.3. Bentley Systems Inc Sales, Revenue, and Gross Margin
      4. 6.2.4. Bentley Systems Inc Revenue and Growth Rate
      5. 6.2.5. Bentley Systems Inc Market Share
      6. 6.2.6. Recent Initiatives, Funding/VC Activities, and Technological Innovations
    3. 6.3. Hexagon AB
      1. 6.3.1. Company Overview
      2. 6.3.2. Product/Service Portfolio
      3. 6.3.3. Hexagon AB Sales, Revenue, and Gross Margin
      4. 6.3.4. Hexagon AB Revenue and Growth Rate
      5. 6.3.5. Hexagon AB Market Share
      6. 6.3.6. Recent Initiatives, Funding/VC Activities, and Technological Innovations
    4. 6.4. Oracle
      1. 6.4.1. Company Overview
      2. 6.4.2. Product/Service Portfolio
      3. 6.4.3. Oracle Sales, Revenue, and Gross Margin
      4. 6.4.4. Oracle Revenue and Growth Rate
      5. 6.4.5. Oracle Market Share
      6. 6.4.6. Recent Initiatives, Funding/VC Activities, and Technological Innovations
    5. 6.5. PTC
      1. 6.5.1. Company Overview
      2. 6.5.2. Product/Service Portfolio
      3. 6.5.3. PTC Sales, Revenue, and Gross Margin
      4. 6.5.4. PTC Revenue and Growth Rate
      5. 6.5.5. PTC Market Share
      6. 6.5.6. Recent Initiatives, Funding/VC Activities, and Technological Innovations
    6. 6.6. Siemens
      1. 6.6.1. Company Overview
      2. 6.6.2. Product/Service Portfolio
      3. 6.6.3. Siemens Sales, Revenue, and Gross Margin
      4. 6.6.4. Siemens Revenue and Growth Rate
      5. 6.6.5. Siemens Market Share
      6. 6.6.6. Recent Initiatives, Funding/VC Activities, and Technological Innovations
    7. 6.7. Dassault Systems Solidworks Corp
      1. 6.7.1. Company Overview
      2. 6.7.2. Product/Service Portfolio
      3. 6.7.3. Dassault Systems Solidworks Corp Sales, Revenue, and Gross Margin
      4. 6.7.4. Dassault Systems Solidworks Corp Revenue and Growth Rate
      5. 6.7.5. Dassault Systems Solidworks Corp Market Share
      6. 6.7.6. Recent Initiatives, Funding/VC Activities, and Technological Innovations
    8. 6.8. Schott Syteme GmbH
      1. 6.8.1. Company Overview
      2. 6.8.2. Product/Service Portfolio
      3. 6.8.3. Schott Syteme GmbH Sales, Revenue, and Gross Margin
      4. 6.8.4. Schott Syteme GmbH Revenue and Growth Rate
      5. 6.8.5. Schott Syteme GmbH Market Share
      6. 6.8.6. Recent Initiatives, Funding/VC Activities, and Technological Innovations
    9. 6.9. ZWSOFT Co. Ltd
      1. 6.9.1. Company Overview
      2. 6.9.2. Product/Service Portfolio
      3. 6.9.3. ZWSOFT Co. Ltd Sales, Revenue, and Gross Margin
      4. 6.9.4. ZWSOFT Co. Ltd Revenue and Growth Rate
      5. 6.9.5. ZWSOFT Co. Ltd Market Share
      6. 6.9.6. Recent Initiatives, Funding/VC Activities, and Technological Innovations
    10. 6.10. Aveva Group plc
      1. 6.10.1. Company Overview
      2. 6.10.2. Product/Service Portfolio
      3. 6.10.3. Aveva Group plc Sales, Revenue, and Gross Margin
      4. 6.10.4. Aveva Group plc Revenue and Growth Rate
      5. 6.10.5. Aveva Group plc Market Share
      6. 6.10.6. Recent Initiatives, Funding/VC Activities, and Technological Innovations
  7. Chapter 7 3D CAD — Industry Analysis
    1. 7.1. Introduction and Taxonomy
    2. 7.2. 3D CAD Market – Key Trends
      1. 7.2.1. Market Drivers
      2. 7.2.2. Market Restraints
      3. 7.2.3. Market Opportunities
    3. 7.3. Value Chain Analysis
    4. 7.4. Key Mandates and Regulations
    5. 7.5. Technology Roadmap and Timeline
    6. 7.6. 3D CAD Market – Attractiveness Analysis
      1. 7.6.1. By Deployment Mode
      2. 7.6.2. By Application
      3. 7.6.3. By Region
  8. Chapter 8 Industrial Chain, Sourcing Strategy, and Downstream Buyers
    1. 8.1. 3D CAD Industrial Chain Analysis
    2. 8.2. Downstream Buyers
    3. 8.3. Distributors/Traders List
  9. Chapter 9 Marketing Strategy Analysis
    1. 9.1. Marketing Channel
    2. 9.2. Direct Marketing
    3. 9.3. Indirect Marketing
    4. 9.4. Marketing Channel Development Trends
    5. 9.5. Economic/Political Environmental Change
  10. Chapter 10 Report Conclusion & Key Insights
    1. 10.1. Key Insights from Primary Interviews & Surveys Respondents
    2. 10.2. Key Takeaways from Analysts, Consultants, and Industry Leaders
  11. Chapter 11 Research Approach & Methodology
    1. 11.1. Report Description
    2. 11.2. Research Scope
    3. 11.3. Research Methodology
      1. 11.3.1. Secondary Research
      2. 11.3.2. Primary Research
      3. 11.3.3. Statistical Models
        1. 11.3.3.1. Company Share Analysis Model
        2. 11.3.3.2. Revenue Based Modeling
      4. 11.3.4. Research Limitations

      List of Figures

      Fig.1	Product Picture of 3D CAD
      Fig.2	Global 3D CAD Market, 2016 – 2026 (USD Billion)
      Fig.3	Global 3D CAD Market Absolute Revenue Opportunity, 2016 – 2026 (USD Billion)
      Fig.4	Global 3D CAD Market Incremental Revenue Opportunity, 2020 – 2026 (USD Billion)
      Fig.5	Global 3D CAD Market Share, by Deployment Mode, 2019 & 2026 (USD Billion)
      Fig.6	Global On Premise 3D CAD Market, 2016 – 2026 (USD Billion)
      Fig.7	Global Cloud Based 3D CAD Market, 2016 – 2026 (USD Billion)
      Fig.8	Global 3D CAD Market Share, by Application, 2019 & 2026 (USD Billion)
      Fig.9	Global Architecture, Engineering, And Construction (AEC) 3D CAD Market, 2016 – 2026 (USD Billion)
      Fig.10	Global Manufacturing  3D CAD Market, 2016 – 2026 (USD Billion)
      Fig.11	Global Automotive  3D CAD Market, 2016 – 2026 (USD Billion)
      Fig.12	Global Healthcare  3D CAD Market, 2016 – 2026 (USD Billion)
      Fig.13	Global Media & Entertainment 3D CAD Market, 2016 – 2026 (USD Billion)
      Fig.14	Global Others 3D CAD Market, 2016 – 2026 (USD Billion)
      Fig.15	Global 3D CAD Market Share, by Region, 2019 & 2026 (USD Billion)
      Fig.16	North America 3D CAD Market, 2016 – 2026 (USD Billion)
      Fig.17	U.S. 3D CAD Market, 2016 – 2026 (USD Billion)
      Fig.18	Canada 3D CAD Market, 2016 – 2026 (USD Billion)
      Fig.19	Europe 3D CAD Market, 2016 – 2026 (USD Billion)
      Fig.20	Germany 3D CAD Market, 2016 – 2026 (USD Billion)
      Fig.21	France 3D CAD Market, 2016 – 2026 (USD Billion)
      Fig.22	U.K. 3D CAD Market, 2016 – 2026 (USD Billion)
      Fig.23	Italy 3D CAD Market, 2016 – 2026 (USD Billion)
      Fig.24	Spain 3D CAD Market, 2016 – 2026 (USD Billion)
      Fig.25	Rest of Europe 3D CAD Market, 2016 – 2026 (USD Billion)
      Fig.26	Asia Pacific 3D CAD Market, 2016 – 2026 (USD Billion)
      Fig.27	China 3D CAD Market, 2016 – 2026 (USD Billion)
      Fig.28	Japan 3D CAD Market, 2016 – 2026 (USD Billion)
      Fig.29	India 3D CAD Market, 2016 – 2026 (USD Billion)
      Fig.30	South  Korea 3D CAD Market, 2016 – 2026 (USD Billion)
      Fig.31	South-East Asia 3D CAD Market, 2016 – 2026 (USD Billion)
      Fig.32	Rest of Asia Pacific 3D CAD Market, 2016 – 2026 (USD Billion)
      Fig.33	Latin America 3D CAD Market, 2016 – 2026 (USD Billion)
      Fig.34	Brazil 3D CAD Market, 2016 – 2026 (USD Billion)
      Fig.35	Mexico 3D CAD Market, 2016 – 2026 (USD Billion)
      Fig.36	Rest of Latin America 3D CAD Market, 2016 – 2026 (USD Billion)
      Fig.37	The Middle-East and Africa 3D CAD Market, 2016 – 2026 (USD Billion)
      Fig.38	GCC Countries 3D CAD Market, 2016 – 2026 (USD Billion)
      Fig.39	South Africa 3D CAD Market, 2016 – 2026 (USD Billion)
      Fig.40	Rest of Middle-East Africa 3D CAD Market, 2016 – 2026 (USD Billion)
      Fig.41	Competitor Market Share – Revenue
      Fig.42	Autodesk Inc Revenue and Growth Rate
      Fig.43	Autodesk Inc Market Share
      Fig.44	Bentley Systems Inc Revenue and Growth Rate
      Fig.45	Bentley Systems Inc Market Share
      Fig.46	Hexagon AB Revenue and Growth Rate
      Fig.47	Hexagon AB Market Share
      Fig.48	Oracle Revenue and Growth Rate
      Fig.49	Oracle Market Share
      Fig.50	PTC Revenue and Growth Rate
      Fig.51	PTC Market Share
      Fig.52	Siemens Revenue and Growth Rate
      Fig.53	Siemens Market Share
      Fig.54	Dassault Systems Solidworks Corp Revenue and Growth Rate
      Fig.55	Dassault Systems Solidworks Corp Market Share
      Fig.56	Schott Syteme GmbH Revenue and Growth Rate
      Fig.57	Schott Syteme GmbH Market Share
      Fig.58	ZWSOFT Co. Ltd Revenue and Growth Rate
      Fig.59	ZWSOFT Co. Ltd Market Share
      Fig.60	Aveva Group plc Revenue and Growth Rate
      Fig.61	Aveva Group plc Market Share
      Fig.62	Market Dynamics
      Fig.63	Global 3D CAD – Value Chain Analysis
      Fig.64	Key Mandates and Regulations
      Fig.65	Technology Roadmap and Timeline
      Fig.66	Market Attractiveness Analysis – By Deployment Mode
      Fig.67	Market Attractiveness Analysis – By Application
      Fig.68	Market Attractiveness Analysis – By Region
      Fig.69	3D CAD Industrial Chain Analysis
      Fig.70	Market Channels
      Fig.71	Marketing Channel Development Trend
      Fig.72	Growth in World Gross Product, 2008-2018
      

      List of Tables

      Table 1	Global 3D CAD Market, 2019 & 2026 (USD Billion)
      Table 2	Global 3D CAD Market, by Deployment Mode, 2016 – 2026 (USD Billion)
      Table 3	Global 3D CAD Market, by Application, 2016 – 2026 (USD Billion)
      Table 4	Global 3D CAD Market, by Region, 2016 – 2026 (USD Billion)
      Table 5	North America 3D CAD Market, by Country, 2016 – 2026 (USD Billion)
      Table 6	North America 3D CAD Market, by Deployment Mode, 2016 – 2026 (USD Billion)
      Table 7	North America 3D CAD Market, by Application, 2016 – 2026 (USD Billion)
      Table 8	Europe 3D CAD Market, by Country, 2016 – 2026 (USD Billion)
      Table 9	Europe 3D CAD Market, by Deployment Mode, 2016 – 2026 (USD Billion)
      Table 10 Europe 3D CAD Market, by Application, 2016 – 2026 (USD Billion)
      Table 11 Asia Pacific 3D CAD Market, by Country, 2016 – 2026 (USD Billion)
      Table 12 Asia Pacific 3D CAD Market, by Deployment Mode, 2016 – 2026 (USD Billion)
      Table 13 Asia Pacific 3D CAD Market, by Application, 2016 – 2026 (USD Billion)
      Table 14 Latin America 3D CAD Market, by Country, 2016 – 2026 (USD Billion)
      Table 15 Latin America 3D CAD Market, by Deployment Mode, 2016 – 2026 (USD Billion)
      Table 16 Latin America 3D CAD Market, by Application, 2016 – 2026 (USD Billion)
      Table 17 The Middle-East and Africa 3D CAD Market, by Country, 2016 – 2026 (USD Billion)
      Table 18 The Middle-East and Africa 3D CAD Market, by Deployment Mode, 2016 – 2026 (USD Billion)
      Table 19 The Middle-East and Africa 3D CAD Market, by Application, 2016 – 2026 (USD Billion)
      Table 20 Global 3D CAD Market - Company Revenue Analysis, 2016 – 2019 (USD Billion)
      Table 21 Global 3D CAD Market - Company Revenue Share Analysis, 2016 – 2019 (%)
      Table 22 Acquisitions and Mergers
      Table 23 Market Drivers – Impact Analysis
      Table 24 Market Restraints
      Table 25 Market Opportunities
      Table 26 Major Buyers of 3D CAD
      Table 27 Distributors/Traders of 3D CAD by Region
      

Industry Major Market Players

  • Autodesk Inc.
  • Bentley Systems Inc.
  • Hexagon AB
  • Oracle
  • PTC
  • Siemens
  • Dassault Systems Solidworks Corp
  • Schott Syteme GmbH
  • ZWSOFT Co. Ltd.
  • Aveva Group plc.