Search Market Research Report

Discover Our Latest Reports
Discover Our Featured Reports
Discover Top Selling Reports

1-Decene Market Size, Share Global Analysis Report, 2021 – 2026

report img

1-Decene Market By Derivate (Polyalphaolefins, Oxo Alcohols, Linear Alkyne Benzene, Linear Mercaptans, Chlorinated Olefins, Alkyl Dimethylamine, & Di-Alkyl Dimethylamine), By Application (Poly Alpha Olefin, Polyethylene, Detergent Alcohol, Synthetic Lubricants, & Others), And By Regions - Global & Regional Industry Perspective, Comprehensive Analysis, and Forecast 2021 – 2026

Industry Insights

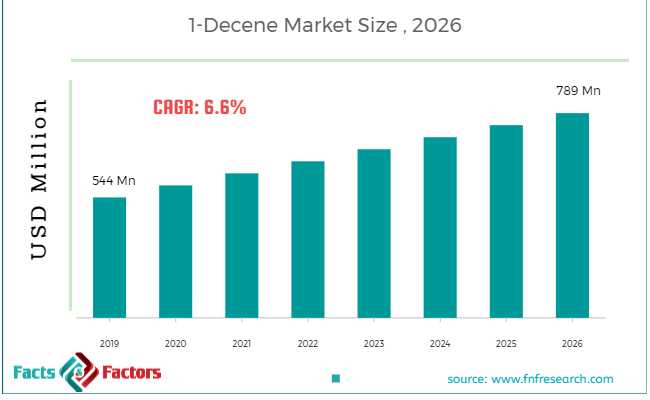
[187+ Pages Report] The latest finding surrounding the “Global 1-Decene Market” published by Facts & Factors offers a neatly packaged and comprehensive read. We at Facts & Factors estimated the global 1-Decene market to reach a projected value of USD 789 Million by 2026 with a growth rate of 6.6% CAGR from an initial value of USD 544 Million in the year 2020.

1-Decene Market

To know more about this report | Request Free Sample Copy

1-decene is the formed structure that contains ten carbon atoms and two hydrogen atoms and it belongs to a specific family of the alkene group. 1-decene has many isomers of decene that are depending on the geometric and structural integrity of the double bond structure. 1-decene is an intermediate form of synthesis of oxo alcohols, synthetic lubricants, epoxides, amines, synthetic fatty acids, and alkylated aromatics.

The global 1-decene market is expected to be occupied by contributing factors attributes to rising demand for PAO-based lubricants and rising industrialization measures on a global purview to name a few. Additionally, a rising group of higher performance group III base oils coupled with rising regulations on automotive manufacturers is expected to increase the footprint of the global 1-decene market during the advent of the forecast period. Moreover, a rising focus of manufacturers on decreasing carbon-based emissions and overall carbon footprint coupled with increasing demand from the sector of food additives will boost the growth of the global 1-decene market during the advent of the forecast period.


logoKey Insights from Primary Research

  • As per our primary respondents, the 1-Decene market is set to grow annually at a rate of around 6.6%.
  • It was established through primary research that the 1-Decene market was valued at around USD 544 Million in 2020.
  • In terms of volume, the 1-Decene market stood at around USD 910 Million, in 2019.
  • The “Oligomerization Method” category, on the basis of type segmentation, was the leading revenue-generating category accounting for around 60% share, in 2019.
  • On the basis of application segmentation, the “Poly Alpha Olefin (PAO)” category held the leading share at more than 62%, in 2019.

logoKey Recommendations from Analysts

  • As per our analysts, 1 decene is expected to have significant demand as the market is suffering from the supply crunch for Poly Alpha Olefin (PAO) which is used for manufacturing synthetic lubricants.
  • 1 decene market is expected to have the largest market share in Europe and North America owing to the favoring of the chemical industry and free trade agreement.
  • Growing at a CAGR of around 5%, 1-Decene market provides numerous opportunities for all of the involved stakeholders across the entire value chain
  • Our analysts have identified the “Oligomerization Method” as the most economical and efficient method to produce 1-Decene.
  • Asia is set to become the fastest-growing region in the forecasted period owing to easy access to raw materials.

The global 1-decene market is driven by rising R&D-based activities coupled with an attentive focus of alpha-olefins from a variety of sources to name a few. Factors pertaining to various applicable norms such as hydroformylation, hydration, alkylation, hydrogenation, halogenations, oligomerization, and polymerization coupled with low-cost ethane supply from increasing shale gas products will fuel the growth of the global 1-decene market during the advent of the forecast period. However, a relative weaker economic growth coupled with a lack of on purpose production methods will decrease the market share during the advent of the forecast period.

To know more about this report | Request Free Sample Copy

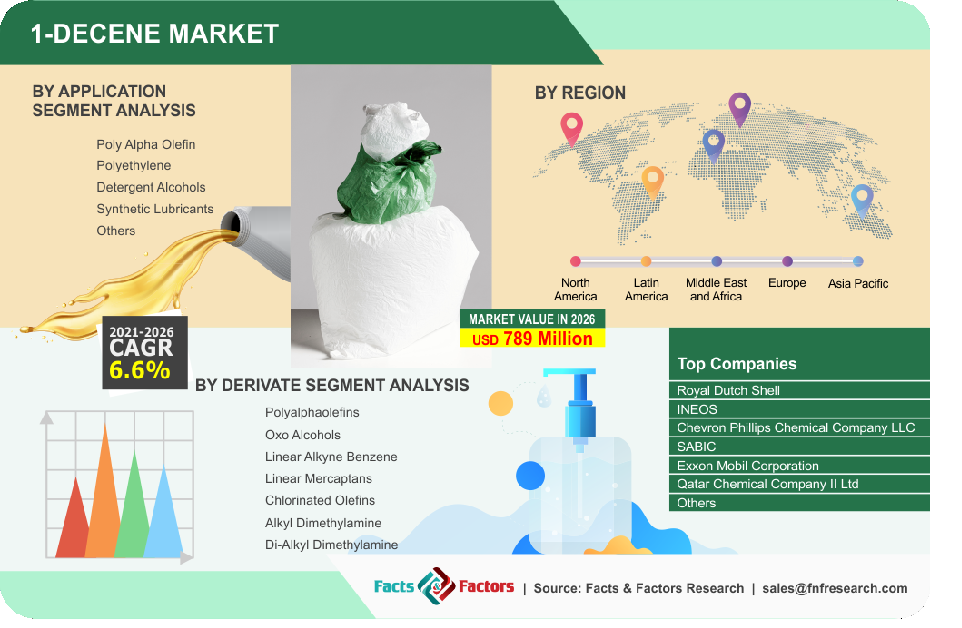
The global 1-decene market is divided into polyalphaolefins, oxo alcohols, linear alkyne benzene, linear mercaptans, chlorinated olefins, alkyl dimethylamine, and di-alkyl dimethylamine on the basis of derivate. The segment pertaining to polyalphaolefins is expected to witness the largest market share during the advent of the forecast period owing to rising demand from the automotive and manufacturing sector coupled with integrated usage into compressor oil, transmission oil, lube-oil additive, and gear oil to name a few.

Based on application, the global 1-decene market is categorized into poly alpha olefin, polyethylene, detergent alcohols, synthetic lubricants, and others. The segment pertaining to synthetic lubricant is expected to witness the largest market share during the advent of the forecast period owing to rising demand from the cosmetic and food & beverage sector coupled with rising environmental regulations in the automotive sector to name a few.

logoReport Scope

Report Attribute

Details

Market Size in 2020

USD 544 Million

Projected Market Size in 2026

USD 789 Million

CAGR Growth Rate

6.6% CAGR

Base Year

2020

Forecast Years

2021-2026

Key Market Players

Royal Dutch Shell, INEOS, Chevron Phillips Chemical Company LLC, SABIC, Exxon Mobil Corporation, Qatar Chemical Company II Ltd, and Others

Key Segments

Derivate, Applications, and Region

Major Regions Covered

North America, Europe, Asia Pacific, Latin America, and Middle East & Africa

Purchase Options

Request customized purchase options to meet your research needs. Explore purchase options

North America is expected to witness the largest market share during the advent of the forecast period owing to rising production of PAO in the region coupled with rising shale gas production and exploration-based activities to name a few. Additionally, the region is home to the key market participants pertaining to the sector which makes the presence of the latter market associated with a larger footprint. Factors pertaining to increasing consumer awareness regarding environmentally friendly use cases and an increase in per capita income among consumers will further push the existing boundaries of the 1-decene market during the advent of the forecast period.

Asia-Pacific is expected to occupy a substantial market share during the advent of the forecast period owing to rising demand from emerging economies such as India and China coupled with favorable government policies regarding a higher production vole in terms of 1-decene to name a few.

logoSome of the leading players in the global market include

  • Royal Dutch Shell
  • INEOS
  • Chevron Phillips Chemical Company LLC
  • SABIC
  • Exxon Mobil Corporation
  • Qatar Chemical Company II Ltd
  • Idemitsu Kosan Co. Ltd.
  • PJSC Nizhnekamskneftekhim
  • Alfa Aesar
  • Merck Group
  • Toronto Chemical Industry Company Limited
  • Spectrum Chemical Mfg Corp
  • Agene Chemicals
  • Gelest Inc.

logoBy Derivate Segment Analysis

  • Polyalphaolefins
  • Oxo Alcohols
  • Linear Alkyne Benzene
  • Linear Mercaptans
  • Chlorinated Olefins
  • Alkyl Dimethylamine
  • Di-Alkyl Dimethylamine

logoBy Application Segment Analysis

  • Poly Alpha Olefin
  • Polyethylene
  • Detergent Alcohols
  • Synthetic Lubricants
  • Others

logoBy Regional Segment Analysis

  • North America
    • U.S.
    • Canada
  • Europe
    • UK
    • France
    • Germany
    • Italy
    • Spain
    • Rest of Europe
  • Asia Pacific
    • China
    • Japan
    • India
    • South Korea
    • Southeast Asia
    • Rest of Asia Pacific
  • Latin America
    • Brazil
    • Mexico
    • Rest of Latin America
  • Middle East and Africa
    • GCC Countries
    • South Africa
    • Rest of MEA

Table of Content

  1. Chapter 1 Executive Summary
    1. 1.1. Introduction of 1-Decene
    2. 1.2. Global 1-Decene Market, 2019 & 2026 (USD Million)
    3. 1.3. Global 1-Decene Market, 2016 – 2026 (USD Million)
    4. 1.4. Global 1-Decene Market Absolute Revenue Opportunity, 2016 – 2026 (USD Million)
    5. 1.5. Global 1-Decene Market Incremental Revenue Opportunity, 2020 – 2026 (USD Million)
  2. Chapter 2 1-Decene Market – Derivate Analysis
    1. 2.1. Global 1-Decene Market – Derivate Overview
    2. 2.2. Global 1-Decene Market Share, by Derivate, 2019 & 2026 (USD Million)
    3. 2.3. Polyalphaolefins
      1. 2.3.1. Global Polyalphaolefins 1-Decene Market, 2016 – 2026 (USD Million)
    4. 2.4. Oxo Alcohols
      1. 2.4.1. Global Oxo Alcohols 1-Decene Market, 2016 – 2026 (USD Million)
    5. 2.5. Linear Alkyne Benzene
      1. 2.5.1. Global Linear Alkyne Benzene 1-Decene Market, 2016 – 2026 (USD Million)
    6. 2.6. Linear Mercaptans
      1. 2.6.1. Global Linear Mercaptans 1-Decene Market, 2016 – 2026 (USD Million)
    7. 2.7. Chlorinated Olefins
      1. 2.7.1. Global Chlorinated Olefins 1-Decene Market, 2016 – 2026 (USD Million)
    8. 2.8. Alkyl Dimethylamine
      1. 2.8.1. Global Alkyl Dimethylamine 1-Decene Market, 2016 – 2026 (USD Million)
    9. 2.9. Di-Alkyl Dimethylamine
      1. 2.9.1. Global Di-Alkyl Dimethylamine 1-Decene Market, 2016 – 2026 (USD Million)
  3. Chapter 3 1-Decene Market – Application Analysis
    1. 3.1. Global 1-Decene Market – Application Overview
    2. 3.2. Global 1-Decene Market Share, by Application, 2019 & 2026 (USD Million)
    3. 3.3. Poly Alpha Olefin
      1. 3.3.1. Global Poly Alpha Olefin 1-Decene Market, 2016 – 2026 (USD Million)
    4. 3.4. Polyethylene
      1. 3.4.1. Global Polyethylene 1-Decene Market, 2016 – 2026 (USD Million)
    5. 3.5. Detergent Alcohols
      1. 3.5.1. Global Detergent Alcohols 1-Decene Market, 2016 – 2026 (USD Million)
    6. 3.6. Synthetic Lubricants
      1. 3.6.1. Global Synthetic Lubricants 1-Decene Market, 2016 – 2026 (USD Million)
    7. 3.7. Others
      1. 3.7.1. Global Others 1-Decene Market, 2016 – 2026 (USD Million)
  4. Chapter 4 1-Decene Market – Regional Analysis
    1. 4.1. Global 1-Decene Market Regional Overview
    2. 4.2. Global 1-Decene Market Share, by Region, 2019 & 2026 (USD Million)
    3. 4.3. North America
      1. 4.3.1. North America 1-Decene Market, 2016 – 2026 (USD Million)
        1. 4.3.1.1. North America 1-Decene Market, by Country, 2016 - 2026 (USD Million)
      2. 4.3.2. North America 1-Decene Market, by Derivate, 2016 – 2026
        1. 4.3.2.1. North America 1-Decene Market, by Derivate, 2016 – 2026 (USD Million)
      3. 4.3.3. North America 1-Decene Market, by Application, 2016 – 2026
        1. 4.3.3.1. North America 1-Decene Market, by Application, 2016 – 2026 (USD Million)
      4. 4.3.4. U.S.
        1. 4.3.4.1. U.S. 1-Decene Market, 2016 – 2026 (USD Million)
      5. 4.3.5. Canada
        1. 4.3.5.1. Canada 1-Decene Market, 2016 – 2026 (USD Million)
    4. 4.4. Europe
      1. 4.4.1. Europe 1-Decene Market, 2016 – 2026 (USD Million)
        1. 4.4.1.1. Europe 1-Decene Market, by Country, 2016 - 2026 (USD Million)
      2. 4.4.2. Europe 1-Decene Market, by Derivate, 2016 – 2026
        1. 4.4.2.1. Europe 1-Decene Market, by Derivate, 2016 – 2026 (USD Million)
      3. 4.4.3. Europe 1-Decene Market, by Application, 2016 – 2026
        1. 4.4.3.1. Europe 1-Decene Market, by Application, 2016 – 2026 (USD Million)
      4. 4.4.4. Germany
        1. 4.4.4.1. Germany 1-Decene Market, 2016 – 2026 (USD Million)
      5. 4.4.5. France
        1. 4.4.5.1. France 1-Decene Market, 2016 – 2026 (USD Million)
      6. 4.4.6. U.K.
        1. 4.4.6.1. U.K. 1-Decene Market, 2016 – 2026 (USD Million)
      7. 4.4.7. Italy
        1. 4.4.7.1. Italy 1-Decene Market, 2016 – 2026 (USD Million)
      8. 4.4.8. Spain
        1. 4.4.8.1. Spain 1-Decene Market, 2016 – 2026 (USD Million)
      9. 4.4.9. Rest of Europe
        1. 4.4.9.1. Rest of Europe 1-Decene Market, 2016 – 2026 (USD Million)
    5. 4.5. Asia Pacific
      1. 4.5.1. Asia Pacific 1-Decene Market, 2016 – 2026 (USD Million)
        1. 4.5.1.1. Asia Pacific 1-Decene Market, by Country, 2016 - 2026 (USD Million)
      2. 4.5.2. Asia Pacific 1-Decene Market, by Derivate, 2016 – 2026
        1. 4.5.2.1. Asia Pacific 1-Decene Market, by Derivate, 2016 – 2026 (USD Million)
      3. 4.5.3. Asia Pacific 1-Decene Market, by Application, 2016 – 2026
        1. 4.5.3.1. Asia Pacific 1-Decene Market, by Application, 2016 – 2026 (USD Million)
      4. 4.5.4. China
        1. 4.5.4.1. China 1-Decene Market, 2016 – 2026 (USD Million)
      5. 4.5.5. Japan
        1. 4.5.5.1. Japan 1-Decene Market, 2016 – 2026 (USD Million)
      6. 4.5.6. India
        1. 4.5.6.1. India 1-Decene Market, 2016 – 2026 (USD Million)
      7. 4.5.7. South Korea
        1. 4.5.7.1. South Korea 1-Decene Market, 2016 – 2026 (USD Million)
      8. 4.5.8. South-East Asia
        1. 4.5.8.1. South-East Asia 1-Decene Market, 2016 – 2026 (USD Million)
      9. 4.5.9. Rest of Asia Pacific
        1. 4.5.9.1. Rest of Asia Pacific 1-Decene Market, 2016 – 2026 (USD Million)
    6. 4.6. Latin America
      1. 4.6.1. Latin America 1-Decene Market, 2016 – 2026 (USD Million)
        1. 4.6.1.1. Latin America 1-Decene Market, by Country, 2016 - 2026 (USD Million)
      2. 4.6.2. Latin America 1-Decene Market, by Derivate, 2016 – 2026
        1. 4.6.2.1. Latin America 1-Decene Market, by Derivate, 2016 – 2026 (USD Million)
      3. 4.6.3. Latin America 1-Decene Market, by Application, 2016 – 2026
        1. 4.6.3.1. Latin America 1-Decene Market, by Application, 2016 – 2026 (USD Million)
      4. 4.6.4. Brazil
        1. 4.6.4.1. Brazil 1-Decene Market, 2016 – 2026 (USD Million)
      5. 4.6.5. Mexico
        1. 4.6.5.1. Mexico 1-Decene Market, 2016 – 2026 (USD Million)
      6. 4.6.6. Rest of Latin America
        1. 4.6.6.1. Rest of Latin America 1-Decene Market, 2016 – 2026 (USD Million)
    7. 4.7. The Middle-East and Africa
      1. 4.7.1. The Middle-East and Africa 1-Decene Market, 2016 – 2026 (USD Million)
        1. 4.7.1.1. The Middle-East and Africa 1-Decene Market, by Country, 2016 - 2026 (USD Million)
      2. 4.7.2. The Middle-East and Africa 1-Decene Market, by Derivate, 2016 – 2026
        1. 4.7.2.1. The Middle-East and Africa 1-Decene Market, by Derivate, 2016 – 2026 (USD Million)
      3. 4.7.3. The Middle-East and Africa 1-Decene Market, by Application, 2016 – 2026
        1. 4.7.3.1. The Middle-East and Africa 1-Decene Market, by Application, 2016 – 2026 (USD Million)
      4. 4.7.4. GCC Countries
        1. 4.7.4.1. GCC Countries 1-Decene Market, 2016 – 2026 (USD Million)
      5. 4.7.5. South Africa
        1. 4.7.5.1. South Africa 1-Decene Market, 2016 – 2026 (USD Million)
      6. 4.7.6. Rest of Middle-East Africa
        1. 4.7.6.1. Rest of Middle-East Africa 1-Decene Market, 2016 – 2026 (USD Million)
  5. Chapter 5 1-Decene Market – Competitive Landscape
    1. 5.1. Competitor Market Share – Revenue
    2. 5.2. Market Concentration Rate Analysis, Top 3 and Top 5 Players
    3. 5.3. Strategic Developments
      1. 5.3.1. Acquisitions and Mergers
      2. 5.3.2. New Products
      3. 5.3.3. Research & Development Activities
  6. Chapter 6 Company Profiles
    1. 6.1. Royal Dutch Shell
      1. 6.1.1. Company Overview
      2. 6.1.2. Product/Service Portfolio
      3. 6.1.3. Royal Dutch Shell Sales, Revenue, and Gross Margin
      4. 6.1.4. Royal Dutch Shell Revenue and Growth Rate
      5. 6.1.5. Royal Dutch Shell Market Share
      6. 6.1.6. Recent Initiatives, Funding/VC Activities, and Technological Innovations
    2. 6.2. INEOS
      1. 6.2.1. Company Overview
      2. 6.2.2. Product/Service Portfolio
      3. 6.2.3. INEOS Sales, Revenue, and Gross Margin
      4. 6.2.4. INEOS Revenue and Growth Rate
      5. 6.2.5. INEOS Market Share
      6. 6.2.6. Recent Initiatives, Funding/VC Activities, and Technological Innovations
    3. 6.3. Chevron Phillips Chemical Company LLC
      1. 6.3.1. Company Overview
      2. 6.3.2. Product/Service Portfolio
      3. 6.3.3. Chevron Phillips Chemical Company LLC Sales, Revenue, and Gross Margin
      4. 6.3.4. Chevron Phillips Chemical Company LLC Revenue and Growth Rate
      5. 6.3.5. Chevron Phillips Chemical Company LLC Market Share
      6. 6.3.6. Recent Initiatives, Funding/VC Activities, and Technological Innovations
    4. 6.4. SABIC
      1. 6.4.1. Company Overview
      2. 6.4.2. Product/Service Portfolio
      3. 6.4.3. SABIC Sales, Revenue, and Gross Margin
      4. 6.4.4. SABIC Revenue and Growth Rate
      5. 6.4.5. SABIC Market Share
      6. 6.4.6. Recent Initiatives, Funding/VC Activities, and Technological Innovations
    5. 6.5. Exxon Mobil Corporation
      1. 6.5.1. Company Overview
      2. 6.5.2. Product/Service Portfolio
      3. 6.5.3. Exxon Mobil Corporation Sales, Revenue, and Gross Margin
      4. 6.5.4. Exxon Mobil Corporation Revenue and Growth Rate
      5. 6.5.5. Exxon Mobil Corporation Market Share
      6. 6.5.6. Recent Initiatives, Funding/VC Activities, and Technological Innovations
    6. 6.6. Qatar Chemical Company II Ltd
      1. 6.6.1. Company Overview
      2. 6.6.2. Product/Service Portfolio
      3. 6.6.3. Qatar Chemical Company II Ltd Sales, Revenue, and Gross Margin
      4. 6.6.4. Qatar Chemical Company II Ltd Revenue and Growth Rate
      5. 6.6.5. Qatar Chemical Company II Ltd Market Share
      6. 6.6.6. Recent Initiatives, Funding/VC Activities, and Technological Innovations
    7. 6.7. Idemitsu Kosan Co. Ltd
      1. 6.7.1. Company Overview
      2. 6.7.2. Product/Service Portfolio
      3. 6.7.3. Idemitsu Kosan Co. Ltd Sales, Revenue, and Gross Margin
      4. 6.7.4. Idemitsu Kosan Co. Ltd Revenue and Growth Rate
      5. 6.7.5. Idemitsu Kosan Co. Ltd Market Share
      6. 6.7.6. Recent Initiatives, Funding/VC Activities, and Technological Innovations
    8. 6.8. PJSC Nizhnekamskneftekhim
      1. 6.8.1. Company Overview
      2. 6.8.2. Product/Service Portfolio
      3. 6.8.3. PJSC Nizhnekamskneftekhim Sales, Revenue, and Gross Margin
      4. 6.8.4. PJSC Nizhnekamskneftekhim Revenue and Growth Rate
      5. 6.8.5. PJSC Nizhnekamskneftekhim Market Share
      6. 6.8.6. Recent Initiatives, Funding/VC Activities, and Technological Innovations
    9. 6.9. Alfa Aesar
      1. 6.9.1. Company Overview
      2. 6.9.2. Product/Service Portfolio
      3. 6.9.3. Alfa Aesar Sales, Revenue, and Gross Margin
      4. 6.9.4. Alfa Aesar Revenue and Growth Rate
      5. 6.9.5. Alfa Aesar Market Share
      6. 6.9.6. Recent Initiatives, Funding/VC Activities, and Technological Innovations
    10. 6.10. Merck Group
      1. 6.10.1. Company Overview
      2. 6.10.2. Product/Service Portfolio
      3. 6.10.3. Merck Group Sales, Revenue, and Gross Margin
      4. 6.10.4. Merck Group Revenue and Growth Rate
      5. 6.10.5. Merck Group Market Share
      6. 6.10.6. Recent Initiatives, Funding/VC Activities, and Technological Innovations
    11. 6.11. Toronto Chemical Industry Company Limited
      1. 6.11.1. Company Overview
      2. 6.11.2. Product/Service Portfolio
      3. 6.11.3. Toronto Chemical Industry Company Limited Sales, Revenue, and Gross Margin
      4. 6.11.4. Toronto Chemical Industry Company Limited Revenue and Growth Rate
      5. 6.11.5. Toronto Chemical Industry Company Limited Market Share
      6. 6.11.6. Recent Initiatives, Funding/VC Activities, and Technological Innovations
    12. 6.12. Spectrum Chemical Mfg Corp
      1. 6.12.1. Company Overview
      2. 6.12.2. Product/Service Portfolio
      3. 6.12.3. Spectrum Chemical Mfg Corp Sales, Revenue, and Gross Margin
      4. 6.12.4. Spectrum Chemical Mfg Corp Revenue and Growth Rate
      5. 6.12.5. Spectrum Chemical Mfg Corp Market Share
      6. 6.12.6. Recent Initiatives, Funding/VC Activities, and Technological Innovations
    13. 6.13. Agene Chemicals
      1. 6.13.1. Company Overview
      2. 6.13.2. Product/Service Portfolio
      3. 6.13.3. Agene Chemicals Sales, Revenue, and Gross Margin
      4. 6.13.4. Agene Chemicals Revenue and Growth Rate
      5. 6.13.5. Agene Chemicals Market Share
      6. 6.13.6. Recent Initiatives, Funding/VC Activities, and Technological Innovations
    14. 6.14. Gelest Inc
      1. 6.14.1. Company Overview
      2. 6.14.2. Product/Service Portfolio
      3. 6.14.3. Gelest Inc Sales, Revenue, and Gross Margin
      4. 6.14.4. Gelest Inc Revenue and Growth Rate
      5. 6.14.5. Gelest Inc Market Share
      6. 6.14.6. Recent Initiatives, Funding/VC Activities, and Technological Innovations
  7. Chapter 7 1-Decene — Industry Analysis
    1. 7.1. Introduction and Taxonomy
    2. 7.2. 1-Decene Market – Key Trends
      1. 7.2.1. Market Drivers
      2. 7.2.2. Market Restraints
      3. 7.2.3. Market Opportunities
    3. 7.3. Value Chain Analysis
    4. 7.4. Key Mandates and Regulations
    5. 7.5. Technology Roadmap and Timeline
    6. 7.6. 1-Decene Market – Attractiveness Analysis
      1. 7.6.1. By Derivate
      2. 7.6.2. By Application
      3. 7.6.3. By Region
  8. Chapter 8 Industrial Chain, Sourcing Strategy, and Downstream Buyers
    1. 8.1. 1-Decene Industrial Chain Analysis
    2. 8.2. Downstream Buyers
    3. 8.3. Distributors/Traders List
  9. Chapter 9 Marketing Strategy Analysis
    1. 9.1. Marketing Channel
    2. 9.2. Direct Marketing
    3. 9.3. Indirect Marketing
    4. 9.4. Marketing Channel Development Trends
    5. 9.5. Economic/Political Environmental Change
  10. Chapter 10 Report Conclusion & Key Insights
    1. 10.1. Key Insights from Primary Interviews & Surveys Respondents
    2. 10.2. Key Takeaways from Analysts, Consultants, and Industry Leaders
  11. Chapter 11 Research Approach & Methodology
    1. 11.1. Report Description
    2. 11.2. Research Scope
    3. 11.3. Research Methodology
      1. 11.3.1. Secondary Research
      2. 11.3.2. Primary Research
      3. 11.3.3. Statistical Models
        1. 11.3.3.1. Company Share Analysis Model
        2. 11.3.3.2. Revenue Based Modeling
      4. 11.3.4. Research Limitations

      List of Figures

      Fig.1	Product Picture of 1-Decene
      Fig.2	Global 1-Decene Market, 2016 – 2026 (USD Million)
      Fig.3	Global 1-Decene Market Absolute Revenue Opportunity, 2016 – 2026 (USD Million)
      Fig.4	Global 1-Decene Market Incremental Revenue Opportunity, 2020 – 2026 (USD Million)
      Fig.5	Global 1-Decene Market Share, by Derivate, 2019 & 2026 (USD Million)
      Fig.6	Global Polyalphaolefins  1-Decene Market, 2016 – 2026 (USD Million)
      Fig.7	Global Oxo Alcohols 1-Decene Market, 2016 – 2026 (USD Million)
      Fig.8	Global Linear Alkyne Benzene  1-Decene Market, 2016 – 2026 (USD Million)
      Fig.9	Global Linear Mercaptans 1-Decene Market, 2016 – 2026 (USD Million)
      Fig.10	Global Chlorinated Olefins 1-Decene Market, 2016 – 2026 (USD Million)
      Fig.11	Global Alkyl Dimethylamine  1-Decene Market, 2016 – 2026 (USD Million)
      Fig.12	Global Di-Alkyl Dimethylamine 1-Decene Market, 2016 – 2026 (USD Million)
      Fig.13	Global 1-Decene Market Share, by Application, 2019 & 2026 (USD Million)
      Fig.14	Global Poly Alpha Olefin  1-Decene Market, 2016 – 2026 (USD Million)
      Fig.15	Global Polyethylene 1-Decene Market, 2016 – 2026 (USD Million)
      Fig.16	Global Detergent Alcohols  1-Decene Market, 2016 – 2026 (USD Million)
      Fig.17	Global Synthetic Lubricants 1-Decene Market, 2016 – 2026 (USD Million)
      Fig.18	Global Others 1-Decene Market, 2016 – 2026 (USD Million)
      Fig.19	Global 1-Decene Market Share, by Region, 2019 & 2026 (USD Million)
      Fig.20	North America 1-Decene Market, 2016 – 2026 (USD Million)
      Fig.21	U.S. 1-Decene Market, 2016 – 2026 (USD Million)
      Fig.22	Canada 1-Decene Market, 2016 – 2026 (USD Million)
      Fig.23	Europe 1-Decene Market, 2016 – 2026 (USD Million)
      Fig.24	Germany 1-Decene Market, 2016 – 2026 (USD Million)
      Fig.25	France 1-Decene Market, 2016 – 2026 (USD Million)
      Fig.26	U.K. 1-Decene Market, 2016 – 2026 (USD Million)
      Fig.27	Italy 1-Decene Market, 2016 – 2026 (USD Million)
      Fig.28	Spain 1-Decene Market, 2016 – 2026 (USD Million)
      Fig.29	Rest of Europe 1-Decene Market, 2016 – 2026 (USD Million)
      Fig.30	Asia Pacific 1-Decene Market, 2016 – 2026 (USD Million)
      Fig.31	China 1-Decene Market, 2016 – 2026 (USD Million)
      Fig.32	Japan 1-Decene Market, 2016 – 2026 (USD Million)
      Fig.33	India 1-Decene Market, 2016 – 2026 (USD Million)
      Fig.34	South  Korea 1-Decene Market, 2016 – 2026 (USD Million)
      Fig.35	South-East Asia 1-Decene Market, 2016 – 2026 (USD Million)
      Fig.36	Rest of Asia Pacific 1-Decene Market, 2016 – 2026 (USD Million)
      Fig.37	Latin America 1-Decene Market, 2016 – 2026 (USD Million)
      Fig.38	Brazil 1-Decene Market, 2016 – 2026 (USD Million)
      Fig.39	Mexico 1-Decene Market, 2016 – 2026 (USD Million)
      Fig.40	Rest of Latin America 1-Decene Market, 2016 – 2026 (USD Million)
      Fig.41	The Middle-East and Africa 1-Decene Market, 2016 – 2026 (USD Million)
      Fig.42	GCC Countries 1-Decene Market, 2016 – 2026 (USD Million)
      Fig.43	South Africa 1-Decene Market, 2016 – 2026 (USD Million)
      Fig.44	Rest of Middle-East Africa 1-Decene Market, 2016 – 2026 (USD Million)
      Fig.45	Competitor Market Share – Revenue
      Fig.46	Royal Dutch Shell Revenue and Growth Rate
      Fig.47	Royal Dutch Shell Market Share
      Fig.48	INEOS Revenue and Growth Rate
      Fig.49	INEOS Market Share
      Fig.50	Chevron Phillips Chemical Company LLC Revenue and Growth Rate
      Fig.51	Chevron Phillips Chemical Company LLC Market Share
      Fig.52	SABIC Revenue and Growth Rate
      Fig.53	SABIC Market Share
      Fig.54	Exxon Mobil Corporation Revenue and Growth Rate
      Fig.55	Exxon Mobil Corporation Market Share
      Fig.56	Qatar Chemical Company II Ltd Revenue and Growth Rate
      Fig.57	Qatar Chemical Company II Ltd Market Share
      Fig.58	Idemitsu Kosan Co. Ltd Revenue and Growth Rate
      Fig.59	Idemitsu Kosan Co. Ltd Market Share
      Fig.60	PJSC Nizhnekamskneftekhim Revenue and Growth Rate
      Fig.61	PJSC Nizhnekamskneftekhim Market Share
      Fig.62	Alfa Aesar Revenue and Growth Rate
      Fig.63	Alfa Aesar Market Share
      Fig.64	Merck Group Revenue and Growth Rate
      Fig.65	Merck Group Market Share
      Fig.66	Toronto Chemical Industry Company Limited Revenue and Growth Rate
      Fig.67	Toronto Chemical Industry Company Limited Market Share
      Fig.68	Spectrum Chemical Mfg Corp Revenue and Growth Rate
      Fig.69	Spectrum Chemical Mfg Corp Market Share
      Fig.70	Agene Chemicals Revenue and Growth Rate
      Fig.71	Agene Chemicals Market Share
      Fig.72	Gelest Inc Revenue and Growth Rate
      Fig.73	Gelest Inc Market Share
      Fig.74	Market Dynamics
      Fig.75	Global 1-Decene – Value Chain Analysis
      Fig.76	Key Mandates and Regulations
      Fig.77	Technology Roadmap and Timeline
      Fig.78	Market Attractiveness Analysis – By Derivate
      Fig.79	Market Attractiveness Analysis – By Application
      Fig.80	Market Attractiveness Analysis – By Region
      Fig.81	1-Decene Industrial Chain Analysis
      Fig.82	Market Channels
      Fig.83	Marketing Channel Development Trend
      Fig.84	Growth in World Gross Product, 2008-2018
      

      List of Tables

      	
      Table 1	Global 1-Decene Market, 2019 & 2026 (USD Million)
      Table 2	Global 1-Decene Market, by Derivate, 2016 – 2026 (USD Million)
      Table 3	Global 1-Decene Market, by Application, 2016 – 2026 (USD Million)
      Table 4	Global 1-Decene Market, by Region, 2016 – 2026 (USD Million)
      Table 5	North America 1-Decene Market, by Country, 2016 – 2026 (USD Million)
      Table 6	North America 1-Decene Market, by Derivate, 2016 – 2026 (USD Million)
      Table 7	North America 1-Decene Market, by Application, 2016 – 2026 (USD Million)
      Table 8	Europe 1-Decene Market, by Country, 2016 – 2026 (USD Million)
      Table 9	Europe 1-Decene Market, by Derivate, 2016 – 2026 (USD Million)
      Table 10Europe 1-Decene Market, by Application, 2016 – 2026 (USD Million)
      Table 11Asia Pacific 1-Decene Market, by Country, 2016 – 2026 (USD Million)
      Table 12Asia Pacific 1-Decene Market, by Derivate, 2016 – 2026 (USD Million)
      Table 13Asia Pacific 1-Decene Market, by Application, 2016 – 2026 (USD Million)
      Table 14Latin America 1-Decene Market, by Country, 2016 – 2026 (USD Million)
      Table 15Latin America 1-Decene Market, by Derivate, 2016 – 2026 (USD Million)
      Table 16Latin America 1-Decene Market, by Application, 2016 – 2026 (USD Million)
      Table 17The Middle-East and Africa 1-Decene Market, by Country, 2016 – 2026 (USD Million)
      Table 18The Middle-East and Africa 1-Decene Market, by Derivate, 2016 – 2026 (USD Million)
      Table 19The Middle-East and Africa 1-Decene Market, by Application, 2016 – 2026 (USD Million)
      Table 20Global 1-Decene Market - Company Revenue Analysis, 2016 – 2019 (USD Million)
      Table 21Global 1-Decene Market - Company Revenue Share Analysis, 2016 – 2019 (%)
      Table 22Acquisitions and Mergers
      Table 23Market Drivers – Impact Analysis
      Table 24Market Restraints
      Table 25Market Opportunities
      Table 26Major Buyers of 1-Decene
      Table 27Distributors/Traders of 1-Decene by Region
      

Industry Major Market Players

  • Royal Dutch Shell
  • INEOS
  • Chevron Phillips Chemical Company LLC
  • SABIC
  • Exxon Mobil Corporation
  • Qatar Chemical Company II Ltd
  • Idemitsu Kosan Co. Ltd.
  • PJSC Nizhnekamskneftekhim
  • Alfa Aesar
  • Merck Group
  • Toronto Chemical Industry Company Limited
  • Spectrum Chemical Mfg Corp
  • Agene Chemicals
  • Gelest Inc.