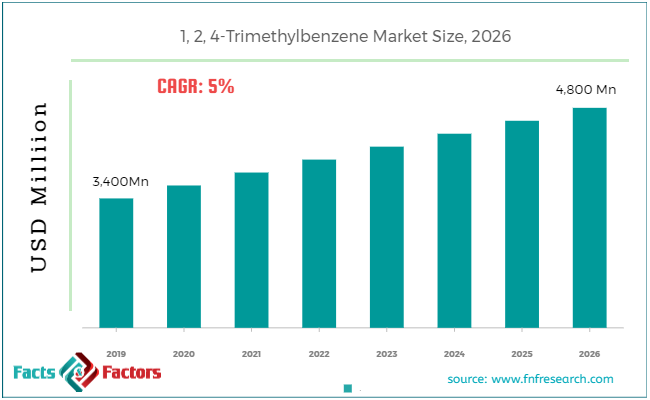
- CHAPTER 1. Executive Summary
- CHAPTER 2. 1, 2, 4-Trimethylbenzene market – Application Analysis
- 2.1. Global 1, 2, 4-Trimethylbenzene Market – Application Overview
- 2.2. Global 1, 2, 4-Trimethylbenzene Market Share, by Application, 2019 & 2026 (USD Million)
- 2.3. Global 1, 2, 4-Trimethylbenzene Market share, by Application, 2019 & 2026 (Kilo Tons)
- 2.4. Trimellitic Anhydride
- 2.4.1. Global Trimellitic Anhydride 1, 2, 4-Trimethylbenzene Market, 2016-2026 (USD Million)
- 2.4.2. Global Trimellitic Anhydride 1, 2, 4-Trimethylbenzene Market, 2016-2026 (Kilo Tons)
- 2.5. 1, 3, 5-Trimethylbenzene
- 2.5.1. Global 1, 3, 5-Trimethylbenzene 1, 2, 4-Trimethylbenzene Market, 2016-2026 (USD Million)
- 2.5.2. Global 1, 3, 5-Trimethylbenzene 1, 2, 4-Trimethylbenzene Market, 2016-2026 (Kilo Tons)
- 2.6. Durene
- 2.6.1. Global Durene 1, 2, 4-Trimethylbenzene Market, 2016-2026 (USD Million)
- 2.6.2. Global Durene 1, 2, 4-Trimethylbenzene Market, 2016-2026 (Kilo Tons)
- 2.7. Others
- 2.7.1. Global Others 1, 2, 4-Trimethylbenzene Market, 2016-2026 (USD Million)
- 2.7.2. Global Others 1, 2, 4-Trimethylbenzene Market, 2016-2026 (Kilo Tons)
- CHAPTER 3. 1, 2, 4-Trimethylbenzene market – Regional Analysis
- 3.1. Global 1, 2, 4-Trimethylbenzene Market Regional Overview
- 3.2. Global 1, 2, 4-Trimethylbenzene Market Share, by Region, 2019 & 2026 (Value)
- 3.3. Global 1, 2, 4-Trimethylbenzene Market Share, by Region, 2019 & 2026 (Volume)
- 3.4. North America
- 3.4.1. North America 1, 2, 4-Trimethylbenzene Market size and forecast, 2016-2026
- 3.4.2. North America 1, 2, 4-Trimethylbenzene Market, by Country, 2016 - 2026 (USD Million)
- 3.4.3. North America Market size and forecast, 2016-2026 (Kilo Tons)
- 3.4.4. North America 1, 2, 4-Trimethylbenzene Market, by Country, 2019 - 2026 (Kilo Tons)
- 3.4.5. North America 1, 2, 4-Trimethylbenzene Market, by Application, 2016-2026
- 3.4.6. U.S.
- 3.4.7. Canada
- 3.5. Europe
- 3.5.1. Europe 1, 2, 4-Trimethylbenzene Market size and forecast, 2016-2026
- 3.5.2. Europe 1, 2, 4-Trimethylbenzene Market, by Country, 2019 - 2026 (USD Million)
- 3.5.3. Europe Market size and forecast, 2016-2026 (Kilo Tons)
- 3.5.4. Europe 1, 2, 4-Trimethylbenzene Market, by Country, 2019 - 2026 (Kilo Tons)
- 3.5.5. Europe 1, 2, 4-Trimethylbenzene Market, by Application, 2016-2026
- 3.5.6. Germany
- 3.5.7. France
- 3.5.8. U.K.
- 3.5.9. Italy
- 3.5.10. Spain
- 3.5.11. Rest of Europe
- 3.6. Asia Pacific
- 3.6.1. Asia Pacific 1, 2, 4-Trimethylbenzene Market size and forecast, 2016-2026
- 3.6.2. Asia Pacific 1, 2, 4-Trimethylbenzene Market, by Country, 2019 - 2026 (USD Million)
- 3.6.3. Asia Pacific Market size and forecast, 2016-2026 (Kilo Tons)
- 3.6.4. Asia Pacific 1, 2, 4-Trimethylbenzene Market, by Country, 2019 - 2026 (Kilo Tons)
- 3.6.5. Asia Pacific 1, 2, 4-Trimethylbenzene Market, by Application, 2016-2026
- 3.6.6. China
- 3.6.7. Japan
- 3.6.8. India
- 3.6.9. South Korea
- 3.6.10. South-East Asia
- 3.6.11. Rest of Asia Pacific
- 3.7. Latin America
- 3.7.1. Latin America 1, 2, 4-Trimethylbenzene Market size and forecast, 2016-2026
- 3.7.2. Latin America 1, 2, 4-Trimethylbenzene Market, by Country, 2019 - 2026 (USD Million)
- 3.7.3. Latin America Market size and forecast, 2016-2026 (Kilo Tons)
- 3.7.4. Latin America 1, 2, 4-Trimethylbenzene Market, by Country, 2019 - 2026 (Kilo Tons)
- 3.7.5. Latin America 1, 2, 4-Trimethylbenzene Market, by Application, 2016-2026
- 3.7.6. Brazil
- 3.7.7. Mexico
- 3.7.8. Rest of Latin America
- 3.8. The Middle-East and Africa
- 3.8.1. The Middle-East and Africa 1, 2, 4-Trimethylbenzene Market size and forecast, 2016-2026
- 3.8.2. The Middle-East and Africa 1, 2, 4-Trimethylbenzene Market, by Country, 2019 - 2026 (USD Million)
- 3.8.3. The Middle-East and Africa Market size and forecast, 2016-2026 (Kilo Tons)
- 3.8.4. The Middle-East and Africa 1, 2, 4-Trimethylbenzene Market, by Country, 2019 - 2026 (Kilo Tons)
- 3.8.5. The Middle-East and Africa 1, 2, 4-Trimethylbenzene Market, by Application, 2016-2026
- 3.8.6. GCC Countries
- 3.8.7. South Africa
- 3.8.8. Rest of Middle-East Africa
- CHAPTER 4. 1, 2, 4-Trimethylbenzene Production, Consumption, Export, Import by Regions
- 4.1. Global 1, 2, 4-Trimethylbenzene production and revenue, 2016-2026 (USD Million) (Kilo Tons)
- 4.2. Global Import and Export Analysis, by Region
- CHAPTER 5. 1, 2, 4-Trimethylbenzene market – Competitive Landscape
- 5.1. Competitor Market Share – Revenue
- 5.2. Market Concentration Rate Analysis, Top 3 and Top 5 Players
- 5.3. Competitor Market Share – Volume
- 5.4. Strategic Development
- 5.4.1. Acquisitions and Mergers
- 5.4.2. New Products
- 5.4.3. Research & Development Activities
- CHAPTER 6. Company Profiles
- 6.1. Flint Hills Resources (FHR)
- 6.1.1. Company Overview
- 6.1.2. Flint Hills Resources (FHR) Sales, Revenue, Price, and Gross Margin
- 6.1.3. Product portfolio
- 6.1.4. Recent initiatives
- 6.2. Eni
- 6.2.1. Company Overview
- 6.2.2. Eni Sales, Revenue, Price, and Gross Margin
- 6.2.3. Product portfolio
- 6.2.4. Recent initiatives
- 6.3. Nanjing Refinery Co., Ltd.
- 6.3.1. Company Overview
- 6.3.2. Nanjing Refinery Co., Ltd. Sales, Revenue, Price, and Gross Margin
- 6.3.3. Product portfolio
- 6.3.4. Recent initiatives
- 6.4. Jinyang Chemical Co., Ltd.
- 6.4.1. Company Overview
- 6.4.2. Jinyang Chemical Co., Ltd. Sales, Revenue, Price, and Gross Margin
- 6.4.3. Product portfolio
- 6.4.4. Recent initiatives
- 6.5. Jiangsu Hualun Chemical Industry Co., Ltd.
- 6.5.1. Company Overview
- 6.5.2. Jiangsu Hualun Chemical Industry Co., Ltd. Sales, Revenue, Price, and Gross Margin
- 6.5.3. Product portfolio
- 6.5.4. Recent initiatives
- 6.6. Lanzhou Petrochemical Company
- 6.6.1. Company Overview
- 6.6.2. Lanzhou Petrochemical Company Sales, Revenue, Price, and Gross Margin
- 6.6.3. Product portfolio
- 6.6.4. Recent initiatives
- 6.7. Dow Chemical Company
- 6.7.1. Company Overview
- 6.7.2. Dow Chemical Company Sales, Revenue, Price, and Gross Margin
- 6.7.3. Product portfolio
- 6.7.4. Recent initiatives
- 6.8. Others
- 6.8.1. Company Overview
- 6.8.2. Others Sales, Revenue, Price, and Gross Margin
- 6.8.3. Product portfolio
- 6.8.4. Recent initiatives
- CHAPTER 7. 1, 2, 4-Trimethylbenzene — Industry Analysis
- 7.1. Introduction and Taxonomy
- 7.2. 1, 2, 4-Trimethylbenzene Market – Key Trends
- 7.2.1. Market Drivers
- 7.2.2. Market Restraints
- 7.2.3. Market Opportunities
- 7.3. Value Chain Analysis
- 7.4. Key Mandates and Regulations
- 7.5. Technology Roadmap and Timeline
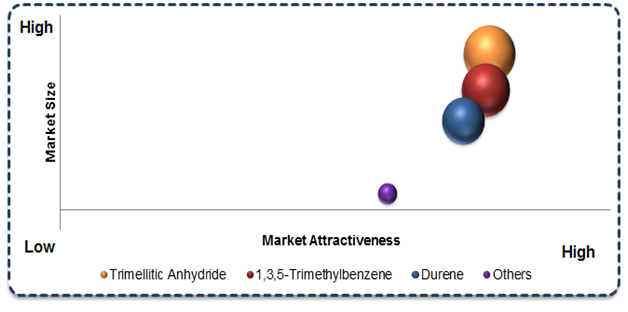
- 7.6. 1, 2, 4-Trimethylbenzene market – Attractiveness Analysis
- 7.6.1. By Application
- 7.6.2. By Region
- CHAPTER 8. Raw Material analysis
- 8.1. 1, 2, 4-Trimethylbenzene Key Raw Material Analysis
- 8.1.1. Key Raw Materials
- 8.1.2. Price Trend of Key Raw Materials
- 8.2. Key Suppliers of Raw Materials
- 8.3. Proportion of Manufacturing Cost Structure
- 8.3.1. Raw Materials
- 8.3.2. Labor Cost
- 8.4. Manufacturing Expenses Analysis of 1, 2, 4-Trimethylbenzene
- CHAPTER 9. Industrial Chain, Sourcing Strategy and Downstream Buyers
- 9.1. 1, 2, 4-Trimethylbenzene Industrial Chain Analysis
- 9.2. Upstream Raw Materials Sourcing
- 9.2.1. Risk Mitigation:
- 9.2.2. Supplier Relationships:
- 9.2.3. Business Processes:
- 9.2.4. Securing the Product:
- 9.3. Raw Materials Sources of 1, 2, 4-Trimethylbenzene Major Manufacturers in 2016
- 9.4. Downstream Buyers
- 9.5. Distributors/Traders List
- CHAPTER 10. Marketing Strategy Analysis, Distributors
- 10.1. Marketing Channel
- 10.2. Direct Marketing
- 10.3. Indirect Marketing
- 10.4. Marketing Channel Development Trend
- 10.5. Economic/Political Environmental Change
- CHAPTER 11. Report Conclusion
- CHAPTER 12. Research Approach & Methodology
- 12.1. Report Description
- 12.2. Research Scope
- 12.3. Research Methodology
- 12.3.1. Secondary Research
- 12.3.2. Primary Research
- 12.3.3. Models
List of Figures
FIG. 1 Global 1, 2, 4-Trimethylbenzene Market, 2016-2026 (USD Million)
FIG. 2 Global 1, 2, 4-Trimethylbenzene Market Share, by Application, 2019 & 2026 (USD Million)
FIG. 3 Global 1, 2, 4-Trimethylbenzene Market share, by Application, 2019 & 2026 (Kilo Tons)
FIG. 4 Global Trimellitic Anhydride 1, 2, 4-Trimethylbenzene Market, 2016-2026 (USD Million)
FIG. 5 Global Trimellitic Anhydride 1, 2, 4-Trimethylbenzene Market, 2016-2026 (Kilo Tons)
FIG. 6 Global 1, 3, 5-Trimethylbenzene 1, 2, 4-Trimethylbenzene Market, 2016-2026 (USD Million)
FIG. 7 Global 1, 3, 5-Trimethylbenzene 1, 2, 4-Trimethylbenzene Market, 2016-2026 (Kilo Tons)
FIG. 8 Global Durene 1, 2, 4-Trimethylbenzene Market, 2016-2026 (USD Million)
FIG. 9 Global Durene 1, 2, 4-Trimethylbenzene Market, 2016-2026 (Kilo Tons)
FIG. 10 Global Others 1, 2, 4-Trimethylbenzene Market, 2016-2026 (USD Million)
FIG. 11 Global Others 1, 2, 4-Trimethylbenzene Market, 2016-2026 (Kilo Tons)
FIG. 12 Global 1, 2, 4-Trimethylbenzene Market Share, by Region, 2019 & 2026
FIG. 13 Global 1, 2, 4-Trimethylbenzene Market Share, by Region, 2019 & 2026
FIG. 14 North America 1, 2, 4-Trimethylbenzene Market, 2016-2026
FIG. 15 North America 1, 2, 4-Trimethylbenzene Market, 2016-2026 (Kilo Tons)
FIG. 16 U.S. 1, 2, 4-Trimethylbenzene Market, 2016-2026
FIG. 17 U.S. 1, 2, 4-Trimethylbenzene Market, 2016-2026 (Kilo Tons)
FIG. 18 Canada 1, 2, 4-Trimethylbenzene Market, 2016-2026
FIG. 19 Canada 1, 2, 4-Trimethylbenzene Market, 2016-2026 (Kilo Tons)
FIG. 20 Europe 1, 2, 4-Trimethylbenzene Market, 2016-2026
FIG. 21 Europe 1, 2, 4-Trimethylbenzene Market, 2016-2026 (Kilo Tons)
FIG. 22 Germany 1, 2, 4-Trimethylbenzene Market, 2016-2026
FIG. 23 Germany 1, 2, 4-Trimethylbenzene Market, 2016-2026 (Kilo Tons)
FIG. 24 France 1, 2, 4-Trimethylbenzene Market, 2016-2026
FIG. 25 France 1, 2, 4-Trimethylbenzene Market, 2016-2026 (Kilo Tons)
FIG. 26 U.K. 1, 2, 4-Trimethylbenzene Market, 2016-2026
FIG. 27 U.K. 1, 2, 4-Trimethylbenzene Market, 2016-2026 (Kilo Tons)
FIG. 28 Italy 1, 2, 4-Trimethylbenzene Market, 2016-2026
FIG. 29 Italy 1, 2, 4-Trimethylbenzene Market, 2016-2026 (Kilo Tons)
FIG. 30 Spain 1, 2, 4-Trimethylbenzene Market, 2016-2026
FIG. 31 Spain 1, 2, 4-Trimethylbenzene Market, 2016-2026 (Kilo Tons)
FIG. 32 Rest of Europe 1, 2, 4-Trimethylbenzene Market, 2016-2026
FIG. 33 Rest of Europe 1, 2, 4-Trimethylbenzene Market, 2016-2026 (Kilo Tons)
FIG. 34 Asia Pacific 1, 2, 4-Trimethylbenzene Market, 2016-2026
FIG. 35 Asia Pacific 1, 2, 4-Trimethylbenzene Market, 2016-2026 (Kilo Tons)
FIG. 36 China 1, 2, 4-Trimethylbenzene Market, 2016-2026
FIG. 37 China 1, 2, 4-Trimethylbenzene Market, 2016-2026 (Kilo Tons)
FIG. 38 Japan 1, 2, 4-Trimethylbenzene Market, 2016-2026
FIG. 39 Japan 1, 2, 4-Trimethylbenzene Market, 2016-2026 (Kilo Tons)
FIG. 40 India 1, 2, 4-Trimethylbenzene Market, 2016-2026
FIG. 41 India 1, 2, 4-Trimethylbenzene Market, 2016-2026 (Kilo Tons)
FIG. 42 South Korea 1, 2, 4-Trimethylbenzene Market, 2016-2026
FIG. 43 South Korea 1, 2, 4-Trimethylbenzene Market, 2016-2026 (Kilo Tons)
FIG. 44 South-East Asia 1, 2, 4-Trimethylbenzene Market, 2016-2026
FIG. 45 South-East Asia 1, 2, 4-Trimethylbenzene Market, 2016-2026 (Kilo Tons)
FIG. 46 Rest of Asia Pacific 1, 2, 4-Trimethylbenzene Market, 2016-2026
FIG. 47 Rest of Asia Pacific 1, 2, 4-Trimethylbenzene Market, 2016-2026 (Kilo Tons)
FIG. 48 Latin America 1, 2, 4-Trimethylbenzene Market, 2016-2026
FIG. 49 Latin America 1, 2, 4-Trimethylbenzene Market, 2016-2026 (Kilo Tons)
FIG. 50 Brazil 1, 2, 4-Trimethylbenzene Market, 2016-2026
FIG. 51 Brazil 1, 2, 4-Trimethylbenzene Market, 2016-2026 (Kilo Tons)
FIG. 52 Mexico 1, 2, 4-Trimethylbenzene Market, 2016-2026
FIG. 53 Mexico 1, 2, 4-Trimethylbenzene Market, 2016-2026 (Kilo Tons)
FIG. 54 Rest of Latin America 1, 2, 4-Trimethylbenzene Market, 2016-2026
FIG. 55 Rest of Latin America 1, 2, 4-Trimethylbenzene Market, 2016-2026 (Kilo Tons)
FIG. 56 The Middle-East and Africa 1, 2, 4-Trimethylbenzene Market, 2016-2026
FIG. 57 The Middle-East and Africa 1, 2, 4-Trimethylbenzene Market, 2016-2026 (Kilo Tons)
FIG. 58 GCC Countries 1, 2, 4-Trimethylbenzene Market, 2016-2026
FIG. 59 GCC Countries 1, 2, 4-Trimethylbenzene Market, 2016-2026 (Kilo Tons)
FIG. 60 South Africa 1, 2, 4-Trimethylbenzene Market, 2016-2026
FIG. 61 South Africa 1, 2, 4-Trimethylbenzene Market, 2016-2026 (Kilo Tons)
FIG. 62 Rest of Middle-East Africa 1, 2, 4-Trimethylbenzene Market, 2016-2026
FIG. 63 Rest of Middle-East Africa 1, 2, 4-Trimethylbenzene Market, 2016-2026 (Kilo Tons)
FIG. 64 Global 1, 2, 4-Trimethylbenzene production and revenue, 2016-2026 (USD Million) (Kilo Tons)
FIG. 65 North America 1, 2, 4-Trimethylbenzene production and revenue, 2016-2026 (USD Million) (Kilo Tons)
FIG. 66 Europe 1, 2, 4-Trimethylbenzene production and revenue, 2016-2026 (USD Million) (Kilo Tons)
FIG. 67 Asia Pacific 1, 2, 4-Trimethylbenzene production and revenue, 2016-2026 (USD Million) (Kilo Tons)
FIG. 68 Latin America 1, 2, 4-Trimethylbenzene production and revenue, 2016-2026 (USD Million) (Kilo Tons)
FIG. 69 Middle East and Africa 1, 2, 4-Trimethylbenzene production and revenue, 2016-2026 (USD Million) (Kilo Tons)
FIG. 70 Competitor Market Share – Revenue
FIG. 71 Competitor Market Share – Volume
FIG. 72 Flint Hills Resources (FHR) Revenue and Growth Rate
FIG. 73 Flint Hills Resources (FHR) Market Share
FIG. 74 Eni Revenue and Growth Rate
FIG. 75 Eni Market Share
FIG. 76 Nanjing Refinery Co., Ltd. Revenue and Growth Rate
FIG. 77 Nanjing Refinery Co., Ltd. Market Share
FIG. 78 Jinyang Chemical Co., Ltd. Revenue and Growth Rate
FIG. 79 Jinyang Chemical Co., Ltd. Market Share
FIG. 80 Jiangsu Hualun Chemical Industry Co., Ltd. Revenue and Growth Rate
FIG. 81 Jiangsu Hualun Chemical Industry Co., Ltd. Market Share
FIG. 82 Lanzhou Petrochemical Company Revenue and Growth Rate
FIG. 83 Lanzhou Petrochemical Company Market Share
FIG. 84 Dow Chemical Company Revenue and Growth Rate
FIG. 85 Dow Chemical Company Market Share
FIG. 86 Others Revenue and Growth Rate
FIG. 87 Others Market Share
FIG. 88 Market Dynamics
FIG. 89 Global 1, 2, 4-Trimethylbenzene – Value Chain Analysis
FIG. 90 Key Mandates and Regulations
FIG. 91 Technology Roadmap and Timeline
FIG. 92 Market Attractiveness Analysis – By Application
FIG. 93 Market Attractiveness Analysis – By Region
FIG. 94 Manufacturing Cost Structure of 1, 2, 4-Trimethylbenzene
FIG. 95 1, 2, 4-Trimethylbenzene Industrial Chain Analysis
FIG. 96 Market Channel
FIG. 97 Marketing Channel Development Trend
FIG. 98 Growth in World Gross Product, 2008-2018
List of Tables
TABLE 1 Global 1, 2, 4-Trimethylbenzene market, 2018 & 2025 (USD Million)
TABLE 2 Global 1, 2, 4-Trimethylbenzene market, by Application, 2016-2026 (USD Million)
TABLE 3 Global 1, 2, 4-Trimethylbenzene market, by Application, 2016-2026 (Kilo Tons)
TABLE 4 Global 1, 2, 4-Trimethylbenzene market, by region, 2016-2026 (USD Million)
TABLE 5 Global 1, 2, 4-Trimethylbenzene market, by region, 2016-2026 (Kilo Tons)
TABLE 6 North America 1, 2, 4-Trimethylbenzene Market, by Application, 2016-2026 (USD Million)
TABLE 7 North America 1, 2, 4-Trimethylbenzene Market, by Application, 2016-2026 (Kilo Tons)
TABLE 8 Europe 1, 2, 4-Trimethylbenzene Market, by Application, 2016-2026 (USD Million)
TABLE 9 Europe 1, 2, 4-Trimethylbenzene Market, by Application, 2016-2026 (Kilo Tons)
TABLE 10 Asia Pacific 1, 2, 4-Trimethylbenzene Market, by Application, 2016-2026 (USD Million)
TABLE 11 Asia Pacific 1, 2, 4-Trimethylbenzene Market, by Application, 2016-2026 (Kilo Tons)
TABLE 12 Latin America 1, 2, 4-Trimethylbenzene Market, by Application, 2016-2026 (USD Million)
TABLE 13 Latin America 1, 2, 4-Trimethylbenzene Market, by Application, 2016-2026 (Kilo Tons)
TABLE 14 The Middle-East and Africa 1, 2, 4-Trimethylbenzene Market, by Application, 2016-2026 (USD Million)
TABLE 15 The Middle-East and Africa 1, 2, 4-Trimethylbenzene Market, by Application, 2016-2026 (Kilo Tons)
TABLE 16 North America 1, 2, 4-Trimethylbenzene Production, Consumption, Export, Import, 2016-2019
TABLE 17 Europe 1, 2, 4-Trimethylbenzene Production, Consumption, Export, Import, 2016-2019
TABLE 18 Asia Pacific 1, 2, 4-Trimethylbenzene Production, Consumption, Export, Import, 2016-2019
TABLE 19 Latin America 1, 2, 4-Trimethylbenzene Production, Consumption, Export, Import, 2016-2019
TABLE 20 Middle East & Africa 1, 2, 4-Trimethylbenzene Production, Consumption, Export, Import, 2016-2019
TABLE 21 Global 1, 2, 4-Trimethylbenzene Market - Company Revenue Analysis 2016-2019 (USD Million)
TABLE 22 Global 1, 2, 4-Trimethylbenzene Market - Company Revenue Share Analysis 2016-2019(%)
TABLE 23 Global 1, 2, 4-Trimethylbenzene Market - Company Volume Analysis 2016-2019 (Kilo Tons)
TABLE 24 Global 1, 2, 4-Trimethylbenzene Market - Company Volume Share Analysis 2016-2019(%)
TABLE 25 Acquisitions and Mergers
TABLE 26 New Product/Service Launch
TABLE 27 Research & Development Activities
TABLE 28 Market Drivers
TABLE 29 Market Restraints
TABLE 30 Market Opportunities
TABLE 31 Production Base and Market Concentration Rate of Raw Material
TABLE 32 Key Suppliers of Raw Materials
TABLE 33 Raw Materials Sources of 1, 2, 4-Trimethylbenzene Major Manufacturers in 2016
TABLE 34 Major Buyers of 1, 2, 4-Trimethylbenzene
TABLE 35 Distributors/Traders of 1, 2, 4-Trimethylbenzene by Region

 Key Insights from Primary Research