![]()
Search Market Research Report
Industrial Rubber Market Size, Share Global Analysis Report, 2022 – 2028

Industrial Rubber Market By Type (Natural Rubber, Synthetic Rubber), By Application (Automotive, Building & Construction, Industrial Manufacturing, Polymer Modification, Wire & Cable, Electrical & Electronics, Bitumen Modification, Coating, Sealant & Adhesive, Medical & Healthcare, Others), By Product (Mechanical Rubber Good, Rubber Hose, Rubber Belt, Rubber Roofing, Others), and By Region - Global Insights, Growth, Size, Comparative Analysis, Trends and Forecast 2022 – 2028
Industry Insights
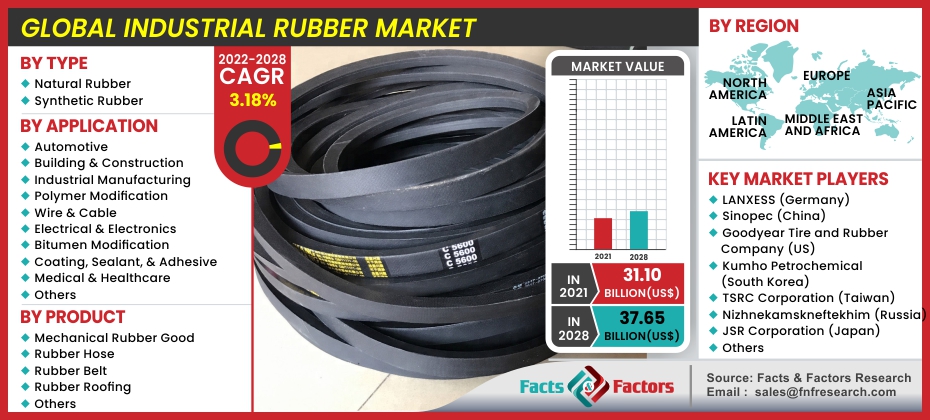
[220+ Pages Report] According to Facts and Factors, the global industrial rubber market was valued at USD 31.10 billion in 2021 and is predicted to increase at a CAGR of 3.18% to USD 37.65 billion by 2028. The study examines the market in terms of revenue in each of the major regions, which are classified into countries.
 Market Overview
Rubber is a durable, elastomeric polymer derived from the latex of tropical plants or synthesized. The industrial rubber market is expanding at a healthy clip, and this trend is projected to continue. This is owing to rising product availability in developing countries, rising disposable income, and expanding demand for rubber-based products. Additionally, the mechanical rubber is also foretold to witness major growth due to an increase in purchasing parity. Besides, the governments are implementing strict mandates to reduce the use and manage the waste of industrial rubber products, and this is created a major challenge for industrial rubber product companies to endure their businesses.
However, strict environmental regulations and health risks associated with industrial rubber, as well as raw material price unpredictability is expected to limit the growth of the industrial rubber market during the forecast period. The industrial rubber product market growth is projected to see a steady rise in the post-pandemic era as the world returns to normal and we see a substantial increase in the industrial rubber market over the upcoming years.
Impact of COVID - 19
COVID-19 had a negative impact on the market in 2020. In the event of a pandemic, automotive manufacturing and mineral mining operations were temporarily halted during the lockdown, resulting in a drop in demand for conveyor and transmission belts, pressure hoses, and other rubber products from end-user industries such as automotive and mining, which has a negative impact on the industrial rubber market. Many industries have suffered because of the government's rigorous laws and restrictions to control the spread of the COVID-19 virus, which have resulted in a loss of workforce, control, resources, and other essentials. Many industries came to a halt as the world struggled to stay alive during the COVID-19 epidemic. The deadly virus influenced the market growth negatively, which was dropping by the day.
Furthermore, natural rubber production has decreased because of delays in an agricultural operations. It also had a negative impact on productivity and consumption. Similarly, during the COVID-19 period, real-estate business, construction, and new building were all talked about, but the rubber industries lacked in that area as well. However, because of the changing dynamics of the world regarding COVID-19, the market is likely to grow in the future.
The complete research study looks at both the qualitative and quantitative aspects of the Industrial Rubber market. Both the demand and supply sides of the market have been investigated. The demand side study examines market income in various regions before comparing it to all of the major countries. The supply-side research examines the industry's top rivals, as well as their regional and global presence and strategies. Each major country in North America, Europe, Asia Pacific, the Middle East, and Africa, and Latin America is thoroughly investigated.
Segmentation Analysis
The global Industrial Rubber market is segregated based on application, product, type, and region.
In terms of type, in 2021, Synthetic rubber is an abrasion-resistant alternative to natural rubber that is widely employed in the automotive industry, fueling the segment's growth. Further, it’s also made in latex form, which is employed as a rubbery adhesive in carpet manufacture. Roll covers, drive couplings, conveyor belts, and adhesives are some of the numerous uses for synthetic rubber.
In terms of Application, Automotive is anticipated to be the leading sub-segment during the forecast period due to speedy growth in automotive and automobile component production in emerging nations such as South Korea, China, and India along with other South-Asian countries. The global demand for rubber-molded components is likely to rise as the automobile sector expands. Furthermore, global automotive sales and production have surpassed pre-recession levels and are expected to expand significantly throughout the forecast period.
Report Scope
Report Attribute |
Details |
Market Size in 2021 |
USD 31.10 Billion |
Projected Market Size in 2028 |
USD 37.65 Billion |
CAGR Growth Rate |
3.18% CAGR |
Base Year |
2021 |
Forecast Years |
2022-2028 |
Key Market Players |
LANXESS (Germany), Sinopec (China), Goodyear Tire and Rubber Company (US), Kumho Petrochemical (South Korea), TSRC Corporation (Taiwan), Nizhnekamskneftekhim (Russia), JSR Corporation (Japan), LG Chem (South Korea), Versalis S.p.A. (Italy), ZEON Corpo, and Others |
Key Segment |
By Type, Application, Product, and Region |
Major Regions Covered |
North America, Europe, Asia Pacific, Latin America, and the Middle East & Africa |
Purchase Options |
Request customized purchase options to meet your research needs. Explore purchase options |
Regional Landscape
The Asia-Pacific region is expected to dominate the Industrial Rubber market in 2021. This is majorly due to rapid urbanization, rising construction activities, and growing demand for industrial rubber from various industries such as automobile and chemicals. Due to increased mining activities, these countries have a significant demand for industrial rubber. With the expanding use of industrial rubber in nations like China, India, Japan, South Korea, and Malaysia, the region's demand is expected to rise in the future years.
Besides, North America and Europe are expected to witness a substantial share in the coming years. This is majorly due to the enhanced demand for industrial rubber from the automotive industry in these regions. Moreover, in the North American industrial rubber market, in 2021, the U.S. is expected to dominate the market whereas Canada is projected to be the fastest-growing in the region over the forecast period.
List of Key Players in the Global Industrial Rubber Market:
- LANXESS (Germany)
- Sinopec (China)
- Goodyear Tire and Rubber Company (US)
- Kumho Petrochemical (South Korea)
- TSRC Corporation (Taiwan)
- Nizhnekamskneftekhim (Russia)
- JSR Corporation (Japan)
- LG Chem (South Korea)
- Versalis S.p.A. (Italy)
- ZEON Corpo
The global industrial rubber market is segmented as follows;
Industrial Rubber Market, By Type:
- Natural Rubber
- Synthetic Rubber
Industrial Rubber Market, By Application:
- Automotive
- Building & Construction
- Industrial Manufacturing
- Polymer Modification
- Wire & Cable
- Electrical & Electronics
- Bitumen Modification
- Coating, Sealant, & Adhesive
- Medical & Healthcare
- Others
Industrial Rubber Market, By Product:
- Mechanical Rubber Good
- Rubber Hose
- Rubber Belt
- Rubber Roofing
- Others
Industrial Rubber Market, By Region
- North America
- The U.S.
- Canada
- Mexico
- Europe
- France
- The UK
- Spain
- Germany
- Italy
- Nordic Countries
- Denmark
- Sweden
- Norway
- Benelux Union
- Belgium
- The Netherlands
- Luxembourg
- Rest of Europe
- Asia Pacific
- China
- Japan
- India
- Australia
- South Korea
- Southeast Asia
- Indonesia
- Thailand
- Malaysia
- Singapore
- Rest of Southeast Asia
- Rest of Asia Pacific
- The Middle East & Africa
- Saudi Arabia
- UAE
- Egypt
- South Africa
- Rest of the Middle East & Africa
- Latin America
- Brazil
- Argentina
- Rest of Latin America
Industry Major Market Players
- LANXESS (Germany)
- Sinopec (China)
- Goodyear Tire and Rubber Company (US)
- Kumho Petrochemical (South Korea)
- TSRC Corporation (Taiwan)
- Nizhnekamskneftekhim (Russia)
- JSR Corporation (Japan)
- LG Chem (South Korea)
- Versalis S.p.A. (Italy)
- ZEON Corpo
Frequently Asked Questions


Copyright © 2025 - 2026, All Rights Reserved, Facts and Factors