![]()
Search Market Research Report
Industrial Hemp Market Size, Share Global Analysis Report, 2024 – 2032

Industrial Hemp Market Size, Share, Growth Analysis Report By Source (Organic and Conventional), By Product Type (Hemp Seeds, Hemp Seeds Oil, Hemp Shivs, and Others), By Application (Food & Beverages, Textiles, Personal Care, Construction Materials, Paper, Pharmaceuticals, Animal Nutrition, and Others), and By Region - Global and Regional Industry Insights, Overview, Comprehensive Analysis, Trends, Statistical Research, Market Intelligence, Historical Data and Forecast 2024 – 2032
Industry Insights
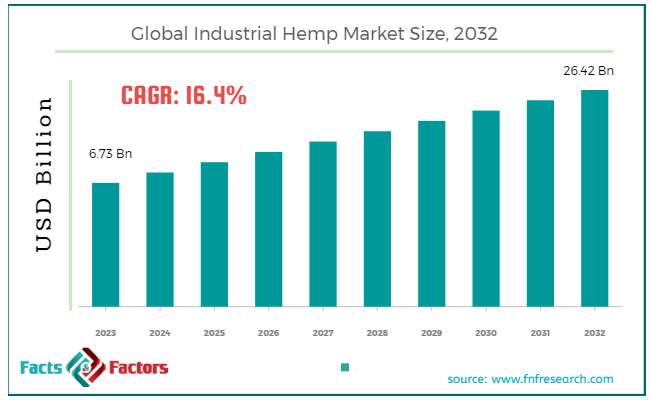
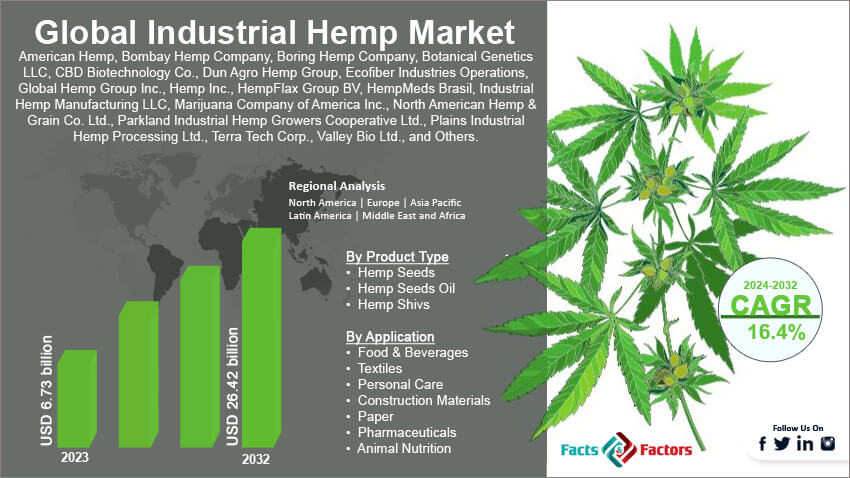
[230+ Pages Report] According to Facts & Factors, the global industrial hemp market size in terms of revenue was valued at around USD 6.73 billion in 2023 and is expected to reach a value of USD 26.42 billion by 2032, growing at a CAGR of roughly 16.4% from 2024 to 2032. The global industrial hemp market is projected to grow at a significant growth rate due to several driving factors.
 Market Overview
Industrial hemp is a variety of the Cannabis sativa plant species that is grown specifically for industrial purposes. It has minimal levels of THC (tetrahydrocannabinol), the psychoactive compound found in marijuana, typically less than 0.3%. This makes hemp non-psychoactive and suitable for a wide range of uses. The plant is highly versatile and can be utilized in various industries, including textiles, construction, biofuels, food and beverages, personal care products, and pharmaceuticals.
The industrial hemp market is witnessing significant growth due to increasing awareness of its environmental benefits and its wide range of applications. The market's expansion is driven by the growing demand for sustainable products, advancements in cultivation and processing technologies, and favorable regulatory changes in many regions.
Key Highlights
- The industrial hemp market has registered a CAGR of 16.4% during the forecast period.
- In terms of revenue, the global industrial hemp market was estimated at roughly USD 6.73 billion in 2023 and is predicted to attain a value of USD 26.42 billion by 2032.
- The industrial hemp market is poised for robust growth, driven by its sustainability, wide range of applications, and supportive regulatory environment. As industries continue to seek eco-friendly alternatives, the demand for hemp-based products is expected to rise significantly.
- Based on the source, the conventional hemp segment is growing at a high rate and is projected to dominate the global market.
- On the basis of product type, the hemp seeds segment is projected to swipe the largest market share.
- Based on the application, the textile segment is expected to dominate the global market.
- By region, the Asia Pacific segment is expected to dominate the global market.
Industrial Hemp Cultivation: A Field of Opportunities, Yet Challenges Remain
The industrial hemp market is experiencing significant growth, driven by a unique set of forces. Let's explore the key factors shaping its future:
Growth Drivers:
- Rising Demand for Sustainable Materials: Consumers and businesses are increasingly seeking eco-friendly alternatives. Hemp's rapid growth rate and minimal water requirements make it an attractive option for various industries.
- Expanding Legalization: The global trend towards legalizing hemp cultivation is opening up new markets and boosting investor confidence.
- Versatility of Hemp Products: Hemp fibers can be used in textiles, construction materials, and bioplastics, while hemp seeds offer nutritional value and are used in food and beverages.
- Potential Health Benefits: CBD, a cannabinoid derived from hemp, is gaining popularity for its potential health benefits, further driving demand for hemp products.
Restraints:
- Regulatory Uncertainty: Vague or evolving regulations in some regions can create confusion and hinder market growth for businesses hesitant to invest.
- Limited Infrastructure & Processing: The infrastructure for processing and manufacturing hemp products is not yet fully established in all regions, creating logistical challenges.
- Consumer Awareness: While awareness of hemp is increasing, some consumers remain confused about its difference from marijuana, potentially impacting market adoption.
Opportunities:
- Technological Advancements: Innovations in processing and manufacturing techniques can improve efficiency and product quality, leading to wider market acceptance.
- Product Development: Developing new and innovative hemp-based products can further expand the market reach and attract new consumer segments.
- Focus on Sustainability: Companies emphasizing the environmental benefits of hemp can attract eco-conscious consumers and businesses seeking sustainable solutions.
- Integration with Existing Industries: Collaboration between the hemp industry and established sectors like textiles and construction can unlock significant growth potential.
Challenges:
- Competition: The industrial hemp market is becoming increasingly competitive, with new players entering the field. This can lead to price pressure and the need for differentiation.
- Price Fluctuations: Fluctuations in the price of raw hemp can impact profitability for businesses operating in the sector.
- Negative Stigma: Residual negative perceptions associated with hemp due to its relation to marijuana can create challenges in some markets.
Industrial Hemp Market: Segmentation Analysis
The global industrial hemp market is segmented based on source, product type, application, and region.
By Source Insights
Based on Source, the global industrial hemp market is divided into organic and conventional. The organic segment, while smaller compared to conventional, is experiencing rapid growth. Organic hemp is cultivated without synthetic fertilizers, pesticides, or genetically modified organisms (GMOs), making it a preferred choice for health-conscious consumers and industries focused on natural and eco-friendly products. There is increasing consumer awareness about the health and environmental benefits of organic products. This has led to a higher demand for organic hemp in various applications, including food, beverages, personal care, and pharmaceuticals?. Organic hemp products often command higher prices due to their perceived superior quality and the cost-intensive nature of organic farming practices. This allows producers to achieve better profit margins??.
Conventional hemp is grown using traditional farming methods, which may include the use of synthetic fertilizers and pesticides. This method allows for higher yields and lower production costs, making it more accessible for large-scale industrial applications. Conventional hemp cultivation is generally more cost-effective than organic farming, allowing for the production of larger quantities at lower costs. This makes it suitable for a wide range of industrial applications, including textiles, construction materials, and automotive parts?. Conventional hemp is used extensively in various industries due to its versatility and the lower cost of production. Applications include food and beverages, personal care products, textiles, and pharmaceuticals??.
By Product Type Insights
On the basis of Product Type, the global industrial hemp market is bifurcated into hemp seeds, hemp seeds oil, hemp shivs, and others. Hemp seeds segment accounted for 30.2% of the total revenue share in 2023 and dominated the market. Hemp seeds are one of the primary products derived from industrial hemp. They are valued for their high nutritional content, including proteins, essential fatty acids, vitamins, and minerals. Hemp seeds are used in a variety of applications, including food products, animal feed, and dietary supplements. Hemp seeds are rich in omega-3 and omega-6 fatty acids, making them a popular ingredient in health foods and dietary supplements. Their high protein content also makes them suitable for vegan and vegetarian diets??. The increasing consumer demand for healthy and natural food products is driving the growth of hemp seeds in the food and beverage industry. They are used in products such as hemp milk, protein bars, and snacks??. Hemp seeds are also used in animal feed due to their nutritional benefits, promoting healthy growth and development in livestock??.
Hemp seed oil is extracted from hemp seeds and is known for its therapeutic and nutritional properties. It is used in a variety of industries, including food, personal care, pharmaceuticals, and cosmetics. Hemp seed oil is rich in essential fatty acids and antioxidants, making it popular in health supplements and wellness products. Its anti-inflammatory properties make it suitable for use in skincare products??. The personal care industry extensively uses hemp seed oil in products like lotions, shampoos, and soaps, capitalizing on its moisturizing and skin-nourishing properties??.
Hemp shivs, also known as hemp hurds, are the woody core parts of the hemp plant. They are primarily used in construction and industrial applications, such as hempcrete, animal bedding, and insulation materials. Hemp shivs are used to produce hempcrete, a sustainable building material that provides excellent insulation and durability. The growing trend towards eco-friendly construction materials is boosting the demand for hemp shivs??. Hemp shivs are highly absorbent and biodegradable, making them an ideal material for animal bedding. They offer a sustainable alternative to traditional bedding materials like straw and wood shavings?.
By Application Insights
Based on Application, the global industrial hemp market is categorized into food & beverages, textiles, personal care, construction materials, paper, pharmaceuticals, animal nutrition, and others. The food and beverages segment is one of the largest applications of industrial hemp. Hemp seeds and hemp oil are rich in proteins, essential fatty acids, vitamins, and minerals, making them popular ingredients in health foods and dietary supplements. The high nutritional content of hemp seeds and oil, including omega-3 and omega-6 fatty acids, proteins, and fiber, drives their use in health foods, protein powders, hemp milk, and snack bars. Increasing awareness of the health benefits of hemp-based food products, along with the growing trend towards plant-based diets, is propelling market growth?.
Textiles segment is expected to dominate the global market during the forecast period. The textiles segment leverages the strong, durable, and environmentally friendly properties of hemp fibers. Hemp is used to produce various textile products, including clothing, footwear, bags, and home furnishings. Hemp is a sustainable crop that requires less water and no pesticides compared to cotton, making it an eco-friendly alternative for textile production. Hemp fibers are known for their strength and durability, as well as their comfort, making them ideal for high-quality textile products??.
Hemp oil and extracts are widely used in personal care products due to their nourishing, moisturizing, and anti-inflammatory properties. These products include skincare, haircare, and cosmetic items. The shift towards natural and organic personal care products boosts the demand for hemp-based ingredients. Hemp oil's benefits for skin health, including its moisturizing and anti-inflammatory properties, make it a popular ingredient in skincare products??
Hemp shivs (the woody core of the hemp plant) are used in construction materials such as hempcrete, fiberboard, and insulation. These materials are valued for their sustainability and thermal properties. Hemp-based construction materials are eco-friendly and contribute to sustainable building practices. Hempcrete and other hemp-based materials provide excellent thermal insulation, contributing to energy-efficient buildings??.
Hemp fibers are used to produce high-quality, durable paper. Hemp paper is an eco-friendly alternative to traditional wood-based paper, offering benefits such as recyclability and reduced environmental impact. Hemp paper production requires fewer chemicals and less water than traditional paper manufacturing, making it a greener option.
Hemp, particularly CBD, is used in the pharmaceutical industry for its therapeutic properties. CBD is utilized in various medicinal products to treat conditions such as pain, anxiety, and neurological disorders??. Growing evidence of the therapeutic benefits of CBD drives its incorporation into pharmaceutical products. Increasing regulatory approvals for hemp-derived pharmaceuticals support market growth?.
Hemp seeds and oil are used in animal nutrition for their high protein and essential fatty acid content. These products are incorporated into animal feed and supplements?. The nutritional profile of hemp makes it an excellent addition to animal diets. Hemp-based feeds can improve the health and well-being of animals?.
Recent Developments:
- February 2023, marked a milestone for Hemp Inc. They shipped a record-breaking 120,000 pounds of their innovative DrillWallTM product. This all-natural kenaf/hemp solution caters to the oil and gas industry, offering a sustainable alternative in well drilling.
- January 2023, HempMeds Brazil catered to the evolving needs of the Brazilian market. They launched two new full-spectrum hemp products, formulated to comply with the latest regulations for doctor recommendations.
- January 2022, looking to expand its footprint, MariMed Inc. signed a deal to acquire Green Growth Group Inc. This acquisition grants MariMed a short-term Cannabis Craft License in Illinois, opening up new market opportunities.
Report Scope
Report Attribute |
Details |
Market Size in 2023 |
USD 6.73 Billion |
Projected Market Size in 2032 |
USD 26.42 Billion |
CAGR Growth Rate |
16.4% CAGR |
Base Year |
2023 |
Forecast Years |
2024-2032 |
Key Market Players |
American Hemp, Bombay Hemp Company, Boring Hemp Company, Botanical Genetics LLC, CBD Biotechnology Co., Dun Agro Hemp Group, Ecofiber Industries Operations, Global Hemp Group Inc., Hemp Inc., HempFlax Group BV, HempMeds Brasil, Industrial Hemp Manufacturing LLC, Marijuana Company of America Inc., North American Hemp & Grain Co. Ltd., Parkland Industrial Hemp Growers Cooperative Ltd., Plains Industrial Hemp Processing Ltd., Terra Tech Corp., Valley Bio Ltd., and Others. |
Key Segment |
By Source, By Product Type, By Application, and By Region |
Major Regions Covered |
North America, Europe, Asia Pacific, Latin America, and the Middle East &, Africa |
Purchase Options |
Request customized purchase options to meet your research needs. Explore purchase options |
Industrial Hemp Market: Regional Analysis
- Asia Pacific is expected to dominate the global market during the forecast period.
Asia Pacific is the leading region in the industrial hemp market, accounting for over 32.8% of the global revenue share in 2023. This dominance is primarily due to extensive cultivation and production in countries such as China, India, Japan, South Korea, and Australia. The region benefits from favorable climatic conditions for hemp farming and a long history of hemp use in various applications, including textiles and food products. The market in Asia Pacific is expected to continue growing rapidly due to increasing demand and technological advancements in hemp harvesting and processing?.
North America, particularly the United States and Canada, is a major consumer and producer of industrial hemp. The market is driven by high consumer disposable income, growing awareness of hemp's health benefits, and the legalization of industrial hemp cultivation. In the U.S., the legalization of hemp has significantly boosted the market, leading to increased production and demand for hemp-based products across various industries, including personal care, food, and pharmaceuticals.
Europe holds a substantial share of the global industrial hemp market, with significant contributions from countries like France, Germany, and the Netherlands. France is the largest hemp producer in Europe, accounting for over 69.7% of the region's production. The European market benefits from strong regulatory support for sustainable and eco-friendly products, which drives the demand for hemp in textiles, construction materials, and personal care products?. The European industrial hemp market is expected to grow at a healthy CAGR during the forecast period, driven by increasing consumer awareness and the expanding applications of hemp in various industries??.
Latin America is an emerging market for industrial hemp, with growing awareness and adoption of hemp products. Countries such as Brazil and Mexico are seeing increased interest in industrial hemp due to its potential applications in food, textiles, and construction materials. Regulatory changes and the legalization of hemp farming are expected to further drive market growth in this region?. The Latin American market is projected to grow steadily as more countries adopt favorable regulations and increase their hemp production capacities??.
The Middle East and Africa are nascent markets for industrial hemp, but they show significant growth potential. South Africa, in particular, is emerging as a key player due to its favorable climate and liberalizing regulations. The region's market growth is driven by the adoption of hemp in industrial applications and the growing interest in sustainable agricultural practices??. The Middle East and Africa are expected to grow at a steady CAGR, supported by increasing product adoption and regulatory changes favouring hemp cultivation??.
Industrial Hemp Market: Competitive Landscape
Some of the main competitors dominating the global industrial hemp market include;
- American Hemp
- Bombay Hemp Company
- Boring Hemp Company
- Botanical Genetics, LLC
- CBD Biotechnology Co.
- Dun Agro Hemp Group
- Ecofiber Industries Operations
- Global Hemp Group Inc.
- Hemp, Inc.
- HempFlax Group BV
- HempMeds Brasil
- Industrial Hemp Manufacturing, LLC
- Marijuana Company of America Inc.
- North American Hemp & Grain Co. Ltd.
- Parkland Industrial Hemp Growers Cooperative Ltd.
- Plains Industrial Hemp Processing Ltd.
- Terra Tech Corp.
- Valley Bio Ltd.
The global industrial hemp market is segmented as follows:
By Source Segment Analysis
- Organic
- Conventional
By Product Type Segment Analysis
- Hemp Seeds
- Hemp Seeds Oil
- Hemp Shivs
- Others
By Application Segment Analysis
- Food & Beverages
- Textiles
- Personal Care
- Construction Materials
- Paper
- Pharmaceuticals
- Animal Nutrition
- Others
By Regional Segment Analysis
- North America
- The U.S.
- Canada
- Mexico
- Europe
- France
- The UK
- Spain
- Germany
- Italy
- Rest of Europe
- Asia Pacific
- China
- Japan
- India
- Australia
- Southeast Asia
- Rest of Asia Pacific
- The Middle East & Africa
- Saudi Arabia
- UAE
- Egypt
- Kuwait
- South Africa
- Rest of the Middle East & Africa
- Latin America
- Brazil
- Argentina
- Rest of Latin America
Industry Major Market Players
- American Hemp
- Bombay Hemp Company
- Boring Hemp Company
- Botanical Genetics, LLC
- CBD Biotechnology Co.
- Dun Agro Hemp Group
- Ecofiber Industries Operations
- Global Hemp Group Inc.
- Hemp, Inc.
- HempFlax Group BV
- HempMeds Brasil
- Industrial Hemp Manufacturing, LLC
- Marijuana Company of America Inc.
- North American Hemp & Grain Co. Ltd.
- Parkland Industrial Hemp Growers Cooperative Ltd.
- Plains Industrial Hemp Processing Ltd.
- Terra Tech Corp.
- Valley Bio Ltd.
Frequently Asked Questions


Copyright © 2025 - 2026, All Rights Reserved, Facts and Factors