![]()
Search Market Research Report
Solar Energy Market Size, Share Global Analysis Report, 2024 – 2032

Solar Energy Market Size, Share, Growth Analysis Report By Technology (Photovoltaic (PV) Systems and Concentrated Solar Power (CSP), By Application (Residential, Commercial, Industrial, and Utility-scale), By End-Use (On-Grid and Off-Grid), And By Region - Global and Regional Industry Insights, Overview, Comprehensive Analysis, Trends, Statistical Research, Market Intelligence, Historical Data and Forecast 2024 – 2032
Industry Insights
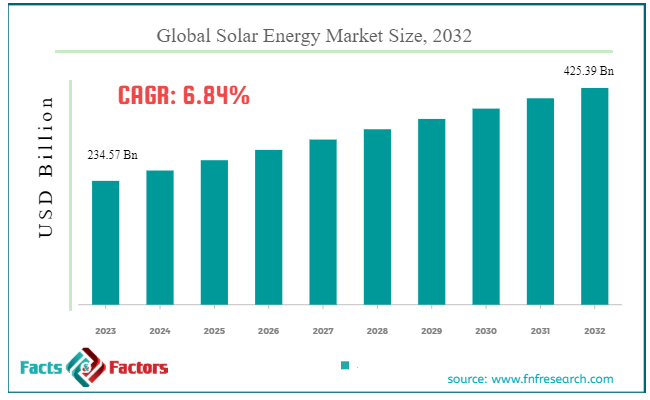
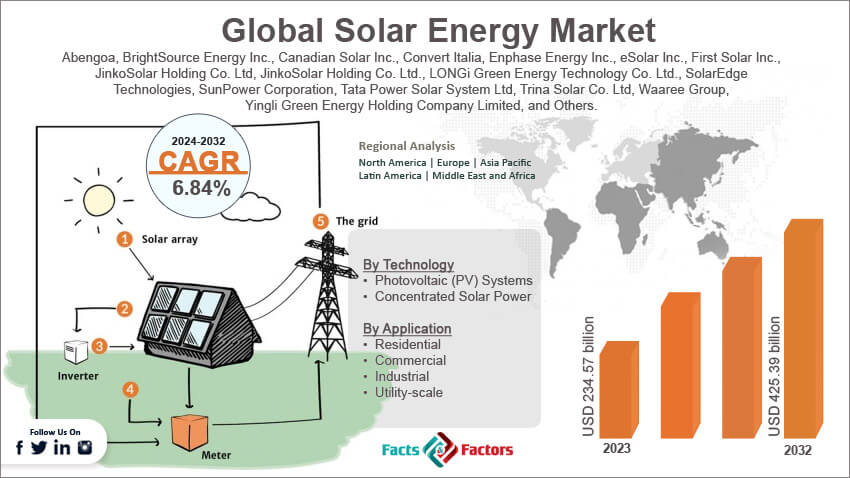
[226+ Pages Report] According to Facts & Factors, the global solar energy market size in terms of revenue was valued at around USD 234.57 billion in 2023 and is expected to reach a value of USD 425.39 billion by 2032, growing at a CAGR of roughly 6.84% from 2024 to 2032. The global solar energy market is projected to grow at a significant growth rate due to several driving factors.
 Market Overview
Solar energy is a form of renewable energy that is produced by converting sunlight into electricity, either directly using photovoltaics (PV) or indirectly using concentrated solar power (CSP). Photovoltaics convert light into an electric current using the photovoltaic effect, while concentrated solar power systems use mirrors or lenses to concentrate a large area of sunlight into a small beam, which is then used as heat to produce power.
The global market for solar energy has grown significantly over the past decade due to declining costs, technological advancements, and a strong push for cleaner energy sources globally. In recent years, solar power capacity has expanded exponentially, making it one of the fastest-growing energy sources worldwide.
Key Highlights
- The solar energy market has registered a CAGR of 6.84% during the forecast period.
- In terms of revenue, the global solar energy market was estimated at roughly USD 234.57 billion in 2023 and is predicted to attain a value of USD 425.39 billion by 2032.
- The growth of the solar energy market is being propelled by growing awareness is pushing a shift towards cleaner energy sources. Also, solar panels and installations are becoming increasingly affordable.
- On the basis of Technology, the Photovoltaic (PV) systems segment is expected to dominate the global market. The PV systems technology remains the most influential due to cost-effectiveness and application versatility.
- Based on End-Use, the on-grid segment is the most dominant due to the large-scale production capacities and substantial power generation contributing to national grids.
- By region, the Asia-Pacific region dominates the global solar energy market in terms of growth rate (CAGR exceeding 9.2%) and total installations. China, in particular, is the largest single market, due to its massive manufacturing capacity and government support for renewable energy as part of its national energy strategy.
Growth Drivers:
- Cost Reduction: The cost of solar panels and installation has significantly decreased, making solar more price-competitive with traditional energy sources.
- Environmental Concerns: Growing public and government awareness of climate change is driving a shift towards clean energy solutions like solar to reduce greenhouse gas emissions.
- Government Support: Many governments are actively promoting solar energy through policies like feed-in tariffs, tax credits, and research and development funding. This creates a more favorable environment for solar investments.
Restraints:
- Upfront Investment: While the long-term economics are attractive, the initial cost of installing a solar system can be a barrier for some homeowners and businesses.
- Grid Integration Challenges: As the penetration of solar energy increases, integrating it effectively into the power grid can be challenging to ensure a consistent and reliable electricity supply.
- Weather Dependence: Solar energy generation depends on sunlight availability. This can be a limitation in regions with frequent cloudy days or limited sunlight hours.
Opportunities:
- Technological Advancements: Continuous advancements in solar panel technology are enhancing efficiency, lifespan, and affordability, further propelling market growth.
- Emerging Markets: Developing countries with high sunshine hours and growing energy needs present a vast potential for solar energy adoption.
- Storage Solutions: Technological breakthroughs in energy storage solutions like advanced batteries can address the issue of intermittency, making solar power a more reliable source of electricity.
Challenges:
- Policy Uncertainty: Changes or inconsistencies in government policies and incentives can create uncertainty for businesses and individuals considering solar investments.
- Competition from Traditional Energy Sources: Fossil fuel industries still hold a strong presence, and lobbying efforts can hinder the development of renewable energy policies.
- Lack of Skilled Workforce: As the solar industry expands, there's a growing need for a skilled workforce to design, install, and maintain solar systems. Addressing this gap is crucial for sustained growth.
Solar Energy Market: Segmentation Analysis
The solar energy market is categorized into various segments based on technology, application, and end-use.
By Technology Insights
Based on Technology, the global solar energy market is bifurcated into photovoltaic (PV) systems and concentrated solar power (CSP). Photovoltaic (PV) systems convert sunlight directly into electricity using semiconductors. Widely used due to simplicity and scalability. This segment has the highest CAGR, driven by continuous improvements in PV cell efficiency and cost reductions. Concentrated Solar Power (CSP) uses mirrors to concentrate a large area of sunlight, or solar thermal energy, to generate heat that drives a power generator. More common in utility-scale projects and regions with significant sunlight.
By Application Insights
Based on Application, the global solar energy market is bifurcated into residential, commercial, industrial, and utility-scale. Residential solar systems are installed on residential buildings to power homes. Includes rooftop panels and, increasingly, solar shingles. This segment is expected to grow substantially as residential consumers look to reduce electricity costs and carbon footprints. Commercial solar installations on commercial buildings, including PV systems and solar heating solutions. The benefits of it include lower energy costs and government incentives for renewable energy installations. Large-scale solar installations are used to power industrial operations. Often involves both PV and CSP technologies to maximize efficiency and output. On the other hand, Utility-Scale are major solar farms that generate large quantities of electricity fed into the power grid. This segment dominates the solar market (CAGR exceeding 11.02%) due to significant investments in large solar projects and the increasing necessity of renewable energy sources in national grids.
By End-Use Insights
Based on End-Use, the global solar energy market is categorized into On-Grid and Off-Grid. On-grid systems that are connected to the public electricity grid. Includes net metering which allows surplus power to be sold to the utility. This segment is growing rapidly as grid parity is achieved in more regions, making solar power increasingly competitive with traditional energy sources. Off-grid are independent systems not connected to any grid, typically used in remote areas and for specific applications like satellite power. Off-grid is essential for providing electricity in remote locations where grid connection is not feasible or too expensive.
Solar Energy Around the World: Recent Developments
- India (October 2023): A major boost for Indian solar! The Solar Energy Corporation of India (SECI) initiated a tender to develop approximately 1 gigawatt (GW) of grid-connected solar projects linked to the interstate transmission network. The projects developed under this initiative are set to enter into a 25-year power purchase agreement with SECI, signaling a significant boost to India's solar infrastructure.
- UK (March 2023): BELECTRIC Solar expands its operations! BELECTRIC Solar Ltd. UK partnered with NextEnergy Solar Fund through a framework agreement to oversee operations and maintenance (O&M) for over 150 MWp of solar projects. This decision came after a competitive tender process managed by WiseEnergy. BELECTRIC will manage a minimum of ten solar farms across the UK, enhancing its O&M operations significantly.
- Australia (November 2022): X-Elio is on a solar spree! They've announced plans to build a 300 MW solar PV farm near Wagga Wagga, New South Wales, along with two additional projects: the Forest Glen Solar Farm (120 MW) and the Wunghnu Solar Farm (80 MW) in Victoria. These developments are part of X-Elio’s ambitious strategy to bolster its renewable portfolio in Australia, which includes over 500 MW of projects in progress.
- China (March 2022): Cainiao Network, a subsidiary of Alibaba Group, began utilizing solar power generated from panels installed on its bonded warehouse roofs in China. This installation covers 100,000 square meters of rooftop space capable of producing 7.862 MW of energy. The generated power not only supports Cainiao’s warehouse operations but also supplies excess electricity to the local grid. Plans are underway to expand this initiative to cover 500,000 square meters by 2023.
Report Scope
Report Attribute |
Details |
Market Size in 2023 |
USD 234.57 Billion |
Projected Market Size in 2032 |
USD 425.39 Billion |
CAGR Growth Rate |
6.84% CAGR |
Base Year |
2023 |
Forecast Years |
2024-2032 |
Key Market Players |
Abengoa, BrightSource Energy Inc., Canadian Solar Inc., Convert Italia, Enphase Energy Inc., eSolar Inc., First Solar Inc., JinkoSolar Holding Co. Ltd, JinkoSolar Holding Co. Ltd., LONGi Green Energy Technology Co. Ltd., SolarEdge Technologies, SunPower Corporation, Tata Power Solar System Ltd, Trina Solar Co. Ltd, Waaree Group, Yingli Green Energy Holding Company Limited, and Others. |
Key Segment |
By Technology, By Application, By End-Use, and By Region |
Major Regions Covered |
North America, Europe, Asia Pacific, Latin America, and the Middle East &, Africa |
Purchase Options |
Request customized purchase options to meet your research needs. Explore purchase options |
Solar Energy Market: Regional Analysis
Asia-Pacific region is the fastest-growing in the solar energy sector, dominated by China and followed by India and Japan. This region reigns supreme in the solar energy market, accounting for over 35.4% of the global market share. The Asia-Pacific benefits from favorable government policies, the vast availability of solar irradiation, and a growing need for sustainable energy solutions to meet the increasing energy demand. Asia-Pacific is expected to exhibit the highest CAGR (around 9.2%) due to large-scale installations, decreasing solar PV costs, and government incentives to promote renewable energy.
For instance, the solar energy sector is witnessing a remarkable surge. Data from the International Renewable Energy Agency reveals a staggering increase of over 110 GW in total installed solar capacity between 2021 and 2022. This translates to a jump from 485 GW in 2021 to an impressive 597 GW in 2022, with China and India leading the pack in terms of installed capacity.
North America, particularly the United States, is a leader in solar energy innovation and deployment. The market is driven by favorable government policies, technological advancements, and significant investment in solar infrastructure. The U.S. solar market is supported by federal incentives such as the Investment Tax Credit (ITC) and renewable portfolio standards set by individual states. The region enjoys a healthy CAGR (expected to be around 6.9%), driven by continuous reductions in solar technology costs and strong policy support.
Europe has been at the forefront of adopting renewable energy technologies, with Germany, the UK, Spain, and Italy leading in solar installations. The European Union’s aggressive carbon reduction targets and community solar projects are significantly contributing to the growth of the solar market. Europe’s solar market is expanding steadily (CAGR around 5.7%), with comprehensive and supportive EU-wide energy policies.
Latin America's solar energy market is burgeoning, with countries like Brazil, Chile, and Mexico emerging as leaders. The growth is spurred by rich solar resources, rising electricity demand, and increasingly favorable government policies and solar auctions. Although starting from a smaller base, the CAGR for Latin America is promising, with extensive untapped solar potential and improving economic conditions.
In the Middle East and Africa, the focus on solar energy is increasing as these regions look to diversify energy sources away from oil and gas. The United Arab Emirates, Saudi Arabia, and Morocco are leading in solar deployment, driven by governmental initiatives and an abundance of solar resources. The market is expected to grow significantly, though issues like political instability and economic variability can affect growth rates.
Solar Energy Market: Competitive Landscape
Several market companies engaged in the global solar energy market include;
- Abengoa
- BrightSource Energy, Inc.
- Canadian Solar Inc.
- Convert Italia
- Enphase Energy, Inc.
- eSolar Inc.
- First Solar, Inc.
- JinkoSolar Holding Co. Ltd
- JinkoSolar Holding Co., Ltd.
- LONGi Green Energy Technology Co. Ltd.
- SolarEdge Technologies
- SunPower Corporation
- Tata Power Solar System Ltd
- Trina Solar Co. Ltd
- Waaree Group
- Yingli Green Energy Holding Company Limited
The global solar energy market is segmented as follows:
By Technology Segment Analysis
- Photovoltaic (PV) Systems
- Concentrated Solar Power (CSP)
By Application Segment Analysis
- Residential
- Commercial
- Industrial
- Utility-scale
By End-Use Segment Analysis
- On-Grid
- Off-Grid
By Regional Segment Analysis
- North America
- The U.S.
- Canada
- Mexico
- Europe
- France
- The UK
- Spain
- Germany
- Italy
- Rest of Europe
- Asia Pacific
- China
- Japan
- India
- Australia
- Southeast Asia
- Rest of Asia Pacific
- The Middle East & Africa
- Saudi Arabia
- UAE
- Egypt
- Kuwait
- South Africa
- Rest of the Middle East & Africa
- Latin America
- Brazil
- Argentina
- Rest of Latin America
Table of Content
Industry Major Market Players
- Abengoa
- BrightSource Energy, Inc.
- Canadian Solar Inc.
- Convert Italia
- Enphase Energy, Inc.
- eSolar Inc.
- First Solar, Inc.
- JinkoSolar Holding Co. Ltd
- JinkoSolar Holding Co., Ltd.
- LONGi Green Energy Technology Co. Ltd.
- SolarEdge Technologies
- SunPower Corporation
- Tata Power Solar System Ltd
- Trina Solar Co. Ltd
- Waaree Group
- Yingli Green Energy Holding Company Limited


Copyright © 2025 - 2026, All Rights Reserved, Facts and Factors