Search Market Research Report

Discover Our Latest Reports
Discover Our Featured Reports
Discover Top Selling Reports

Specialty Chemicals Market Size, Share, Growth, Trends Analysis Forecast 2021-2026

report img

Specialty Chemicals Market By Product (Specialty Polymers, Institutional & Industrial Cleaners, Electronics Chemicals, Rubber Processing Chemicals, Flavors & Fragrances, Construction Chemicals, Food & Feed Additives, Cosmetic Chemicals, Oilfield Chemicals, Mining Chemicals, Pharmaceutical & Nutraceutical Additives, Plastic Additives, Printing Inks, Coatings, Adhesives, Sealants, And Elastomers (CASE), Catalysts, Water Treatment Chemicals, Corrosion Inhibitors, Flame Retardants, & Others), And By Regions - Global & Regional Industry Perspective, Comprehensive Analysis, and Forecast 2021–2026

Industry Insights

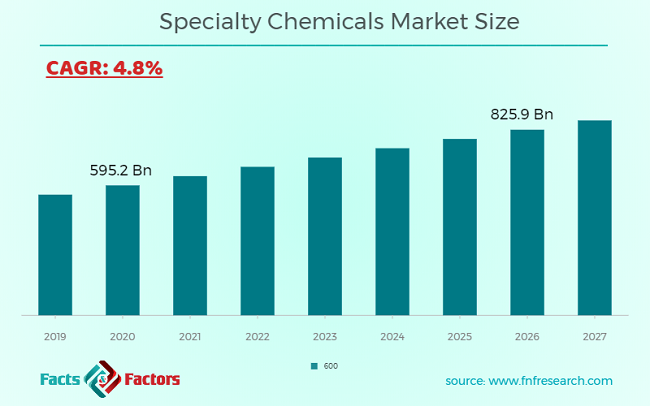
[215+ Pages Report] The latest findings and offering on the specialty chemicals market released by Facts & Factors offers a neatly titled “Global Specialty Chemicals Market”. In this report, the global specialty chemicals market exhibited USD 595.2 billion in the year 2020 and will grow at an estimated CAGR rate of 4.8% to an overall value of USD 825.9 Billion in the year 2026.

Specialty Chemicals Market Size

To know more about this report | Request Free Sample Copy

logoMarket Overview

Specialty chemicals or specialties or effect chemicals are the particular brand of chemical products that have the ability to distort a wider range of effects. Some of the categories of specialty chemicals can be branded as adhesives, agrichemicals, chemical materials, colors, cosmetic additives, construction chemicals, elastomers flavors, fragrances, and paints to name a few. Such industrial sectors such as automotive, aerospace, food, cosmetics, and agricultures are extremely dependent on such products.

logoIndustry Growth Factors

The primary driving factors for the significant growth of the global specialty chemicals market are rising demand for high-performance and function-specific chemicals coupled with increasing demand from the sectors of oil & gas, pulp & paper, and personal care and cosmetics to name a few. Additionally, integration of specialty chemicals in essential oils, gelatin, castor oil, and collagen coupled with rising innovation techniques in the sector is expected to increase the footprint of the global specialty chemicals market during the advent of the forecast period. Moreover, increasing R&D activities coupled with increased adoption of rechargeable and sustainable electronic components will boost the growth of the global specialty chemicals market during the advent of the forecast period.

The global specialty chemicals market is driven by rising demand from the automotive sector in terms of adhesives, lubricants, and paints coupled with increasing adoption of a healthier lifestyle to name a few. Increasing disposable income among consumers coupled with rapid industrialization measures will fuel the growth of the global specialty chemicals market during the advent of the forecast period. However, rising consumer awareness about the harmful effects of conventional chemicals on the environment coupled with increasing technicalities for production measures will hamper the growth of the global specialty chemicals market during the advent of the forecast period.

Specialty Chemicals Market

To know more about this report | Request Free Sample Copy

logoSegmentation Analysis

The global specialty chemicals market is segmented into product and region.

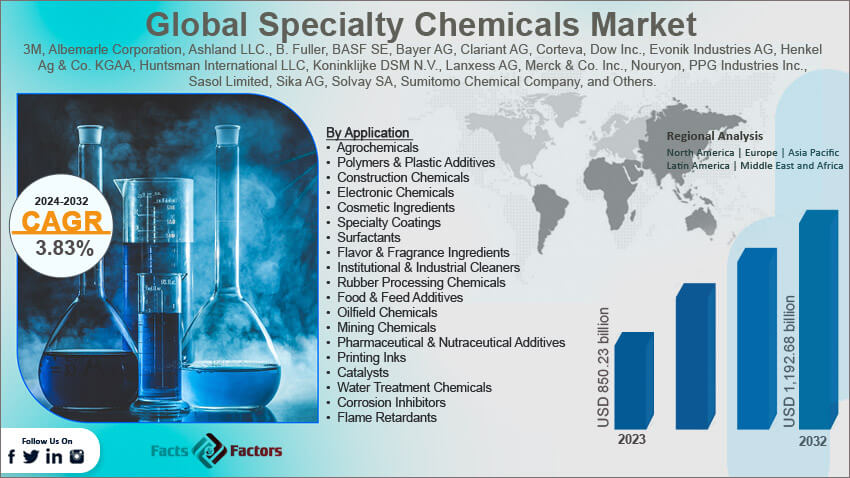
On the basis of product, the global specialty chemicals market is categorized into specialty polymers, institutional & industrial cleaners, electronics chemicals, rubber processing chemicals, flavors & fragrances, construction chemicals, food & feed additives, cosmetic chemicals, oilfield chemicals, mining chemicals, pharmaceutical & nutraceutical additives, plastic additives, printing inks, coatings, adhesives, sealants, and elastomers (CASE), catalysts, water treatment chemicals, corrosion inhibitors, flame retardants, and others. The segment pertaining to industrial and institutional cleaners segment is expected to witness the largest market share during the advent of the forecast period owing to numerous technological advancements in terms of product innovations coupled with rising demand for water-proofing compounds to name a few. The region of oilfield chemicals is expected to witness a substantial market share during the advent of the forecast period owing to the rapid expansion of refining capacity in terms of shale oil and gas drilling activities coupled with the increasing growth of oil refineries to name a few. The construction chemicals category is expected to present a lucrative opportunity during the forecast period owing to increasing growth projections in terms of erecting infrastructure coupled with rising demand for repair & renovation compounds, joint fillers, and tile fixing adhesives to name a few.

logo Report Scope

Report Attribute

Details

Market Size in 2020

USD 595.2 Billion

Projected Market Size in 2026

USD 825.9 Billion

CAGR Growth Rate

4.8% CAGR

Base Year

2020

Forecast Years

2021-2026

Key Market Players

Solvay AG, Evonik Industries AG, Clariant AG, Akzo Nobel N.V., BASF SE, Kemira Oyj, LANXESS AG, Croda International plc., and Others

Key Segments

Products, and Region

Major Regions Covered

North America, Europe, Asia Pacific, Latin America, and Middle East & Africa

Purchase Options

Request customized purchase options to meet your research needs. Explore purchase options

logo Regional Analysis

Asia-Pacific is expected to witness the largest market share during the advent of the forecast period owing to rising demand from the sectors of pharmaceuticals and nutraceuticals, personal care and cosmetics, automotive, and electric and electronic coupled with growing diversification measures to name a few. Additionally, increasing industrialization coupled with improving standards of living in the region will further push the existing boundaries of the specialty chemicals market during the advent of the forecast period. Europe is expected to witness a warm market growth during the advent of the forecast period owing to the latter being a huge exporter coupled with rising oilfields to name a few. Rapid growth of the construction activities coupled with the rising number of oil and gas firms in the region will increase the footprint of the specialty chemicals market during the advent of the forecast period.

logo Competitive Players

The key market participants for the global specialty chemicals market are

  • Solvay AG
  • Evonik Industries AG
  • Clariant AG
  • Akzo Nobel N.V.
  • BASF SE
  • Kemira Oyj
  • LANXESS AG
  • Croda International plc.
  • Huntsman International LLC
  • The Lubrizol Corporation
  • Albemarle Corporation
  • Dow Inc.
  • Sumimoto Industries
  • Ashland LLC
  • Henkel Ag & Co KGAA.
  • 3M

logo By Product Segment Analysis

  • Specialty Polymers
  • Institutional & Industrial Cleaners
  • Electronics Chemicals
  • Rubber Processing Chemicals
  • Flavors & Fragrances
  • Construction Chemicals
  • Food & Feed Additives
  • Cosmetic Chemicals
  • Oilfield Chemicals
  • Mining Chemicals
  • Pharmaceutical & Nutraceutical Additives
  • Plastic Additives
  • Printing Inks
  • Coatings, Adhesives, Sealants, And Elastomers (CASE)
  • Catalysts
  • Water Treatment Chemicals
  • Corrosion Inhibitors
  • Flame Retardants
  • Others

logo By Regional Segment Analysis

  • North America
    • U.S.
    • Canada
  • Europe
    • UK
    • France
    • Germany
    • Italy
    • Spain
    • Rest of Europe
  • Asia Pacific
    • China
    • Japan
    • India
    • South Korea
    • Southeast Asia
    • Rest of Asia Pacific
  • Latin America
    • Brazil
    • Mexico
    • Rest of Latin America
  • Middle East and Africa
    • GCC Countries
    • South Africa
    • Rest of MEA

Table of Content

  1. Chapter 1 Executive Summary
    1. 1.1. Introduction of Specialty Chemicals
    2. 1.2. Global Specialty Chemicals Market, 2019 & 2026 (USD Billion)
    3. 1.3. Global Specialty Chemicals Market, 2016 – 2026 (USD Billion)
    4. 1.4. Global Specialty Chemicals Market Absolute Revenue Opportunity, 2016 – 2026 (USD Billion)
    5. 1.5. Global Specialty Chemicals Market Incremental Revenue Opportunity, 2020 – 2026 (USD Billion)
  2. Chapter 2 Specialty Chemicals Market – Product Analysis
    1. 2.1. Global Specialty Chemicals Market – Product Overview
    2. 2.2. Global Specialty Chemicals Market Share, by Product, 2019 & 2026 (USD Billion)
    3. 2.3. Specialty Polymers
      1. 2.3.1. Global Specialty Polymers Specialty Chemicals Market, 2016 – 2026 (USD Billion)
    4. 2.4. Institutional & Industrial Cleaners
      1. 2.4.1. Global Institutional & Industrial Cleaners Specialty Chemicals Market, 2016 – 2026 (USD Billion)
    5. 2.5. Electronics Chemicals
      1. 2.5.1. Global Electronics Chemicals Specialty Chemicals Market, 2016 – 2026 (USD Billion)
    6. 2.6. Rubber Processing Chemicals
      1. 2.6.1. Global Rubber Processing Chemicals Specialty Chemicals Market, 2016 – 2026 (USD Billion)
    7. 2.7. Flavors & Fragrances
      1. 2.7.1. Global Flavors & Fragrances Specialty Chemicals Market, 2016 – 2026 (USD Billion)
    8. 2.8. Construction Chemicals
      1. 2.8.1. Global Construction Chemicals Specialty Chemicals Market, 2016 – 2026 (USD Billion)
    9. 2.9. Food & Feed Additives
      1. 2.9.1. Global Food & Feed Additives Specialty Chemicals Market, 2016 – 2026 (USD Billion)
    10. 2.10. Cosmetic Chemicals
      1. 2.10.1. Global Cosmetic Chemicals Specialty Chemicals Market, 2016 – 2026 (USD Billion)
    11. 2.11. Oilfield Chemicals
      1. 2.11.1. Global Oilfield Chemicals Specialty Chemicals Market, 2016 – 2026 (USD Billion)
    12. 2.12. Mining Chemicals
      1. 2.12.1. Global Mining Chemicals Specialty Chemicals Market, 2016 – 2026 (USD Billion)
    13. 2.13. Pharmaceutical & Nutraceutical Additives
      1. 2.13.1. Global Pharmaceutical & Nutraceutical Additives Specialty Chemicals Market, 2016 – 2026 (USD Billion)
    14. 2.14. Plastic Additives
      1. 2.14.1. Global Plastic Additives Specialty Chemicals Market, 2016 – 2026 (USD Billion)
    15. 2.15. Printing Inks
      1. 2.15.1. Global Printing Inks Specialty Chemicals Market, 2016 – 2026 (USD Billion)
    16. 2.16. CASE (Coatings, Adhesives, Sealants, And Elastomers)
      1. 2.16.1. Global CASE (Coatings, Adhesives, Sealants, And Elastomers) Specialty Chemicals Market, 2016 – 2026 (USD Billion)
    17. 2.17. Catalysts
      1. 2.17.1. Global Catalysts Specialty Chemicals Market, 2016 – 2026 (USD Billion)
    18. 2.18. Water Treatment Chemicals
      1. 2.18.1. Global Water Treatment Chemicals Specialty Chemicals Market, 2016 – 2026 (USD Billion)
    19. 2.19. Corrosion Inhibitors
      1. 2.19.1. Global Corrosion Inhibitors Specialty Chemicals Market, 2016 – 2026 (USD Billion)
    20. 2.20. Flame Retardants
      1. 2.20.1. Global Flame Retardants Specialty Chemicals Market, 2016 – 2026 (USD Billion)
    21. 2.21. Others
      1. 2.21.1. Global Others Specialty Chemicals Market, 2016 – 2026 (USD Billion)
  3. Chapter 3 Specialty Chemicals Market – Regional Analysis
    1. 3.1. Global Specialty Chemicals Market Regional Overview
    2. 3.2. Global Specialty Chemicals Market Share, by Region, 2019 & 2026 (USD Billion)
    3. 3.3. North America
      1. 3.3.1. North America Specialty Chemicals Market, 2016 – 2026 (USD Billion)
        1. 3.3.1.1. North America Specialty Chemicals Market, by Country, 2016 - 2026 (USD Billion)
      2. 3.3.2. North America Specialty Chemicals Market, by Product, 2016 – 2026
        1. 3.3.2.1. North America Specialty Chemicals Market, by Product, 2016 – 2026 (USD Billion)
      3. 3.3.3. U.S.
        1. 3.3.3.1. U.S. Specialty Chemicals Market, 2016 – 2026 (USD Billion)
      4. 3.3.4. Canada
        1. 3.3.4.1. Canada Specialty Chemicals Market, 2016 – 2026 (USD Billion)
    4. 3.4. Europe
      1. 3.4.1. Europe Specialty Chemicals Market, 2016 – 2026 (USD Billion)
        1. 3.4.1.1. Europe Specialty Chemicals Market, by Country, 2016 - 2026 (USD Billion)
      2. 3.4.2. Europe Specialty Chemicals Market, by Product, 2016 – 2026
        1. 3.4.2.1. Europe Specialty Chemicals Market, by Product, 2016 – 2026 (USD Billion)
      3. 3.4.3. Germany
        1. 3.4.3.1. Germany Specialty Chemicals Market, 2016 – 2026 (USD Billion)
      4. 3.4.4. France
        1. 3.4.4.1. France Specialty Chemicals Market, 2016 – 2026 (USD Billion)
      5. 3.4.5. U.K.
        1. 3.4.5.1. U.K. Specialty Chemicals Market, 2016 – 2026 (USD Billion)
      6. 3.4.6. Italy
        1. 3.4.6.1. Italy Specialty Chemicals Market, 2016 – 2026 (USD Billion)
      7. 3.4.7. Spain
        1. 3.4.7.1. Spain Specialty Chemicals Market, 2016 – 2026 (USD Billion)
      8. 3.4.8. Rest of Europe
        1. 3.4.8.1. Rest of Europe Specialty Chemicals Market, 2016 – 2026 (USD Billion)
    5. 3.5. Asia Pacific
      1. 3.5.1. Asia Pacific Specialty Chemicals Market, 2016 – 2026 (USD Billion)
        1. 3.5.1.1. Asia Pacific Specialty Chemicals Market, by Country, 2016 - 2026 (USD Billion)
      2. 3.5.2. Asia Pacific Specialty Chemicals Market, by Product, 2016 – 2026
        1. 3.5.2.1. Asia Pacific Specialty Chemicals Market, by Product, 2016 – 2026 (USD Billion)
      3. 3.5.3. China
        1. 3.5.3.1. China Specialty Chemicals Market, 2016 – 2026 (USD Billion)
      4. 3.5.4. Japan
        1. 3.5.4.1. Japan Specialty Chemicals Market, 2016 – 2026 (USD Billion)
      5. 3.5.5. India
        1. 3.5.5.1. India Specialty Chemicals Market, 2016 – 2026 (USD Billion)
      6. 3.5.6. South Korea
        1. 3.5.6.1. South Korea Specialty Chemicals Market, 2016 – 2026 (USD Billion)
      7. 3.5.7. South-East Asia
        1. 3.5.7.1. South-East Asia Specialty Chemicals Market, 2016 – 2026 (USD Billion)
      8. 3.5.8. Rest of Asia Pacific
        1. 3.5.8.1. Rest of Asia Pacific Specialty Chemicals Market, 2016 – 2026 (USD Billion)
    6. 3.6. Latin America
      1. 3.6.1. Latin America Specialty Chemicals Market, 2016 – 2026 (USD Billion)
        1. 3.6.1.1. Latin America Specialty Chemicals Market, by Country, 2016 - 2026 (USD Billion)
      2. 3.6.2. Latin America Specialty Chemicals Market, by Product, 2016 – 2026
        1. 3.6.2.1. Latin America Specialty Chemicals Market, by Product, 2016 – 2026 (USD Billion)
      3. 3.6.3. Brazil
        1. 3.6.3.1. Brazil Specialty Chemicals Market, 2016 – 2026 (USD Billion)
      4. 3.6.4. Mexico
        1. 3.6.4.1. Mexico Specialty Chemicals Market, 2016 – 2026 (USD Billion)
      5. 3.6.5. Rest of Latin America
        1. 3.6.5.1. Rest of Latin America Specialty Chemicals Market, 2016 – 2026 (USD Billion)
    7. 3.7. The Middle-East and Africa
      1. 3.7.1. The Middle-East and Africa Specialty Chemicals Market, 2016 – 2026 (USD Billion)
        1. 3.7.1.1. The Middle-East and Africa Specialty Chemicals Market, by Country, 2016 - 2026 (USD Billion)
      2. 3.7.2. The Middle-East and Africa Specialty Chemicals Market, by Product, 2016 – 2026
        1. 3.7.2.1. The Middle-East and Africa Specialty Chemicals Market, by Product, 2016 – 2026 (USD Billion)
      3. 3.7.3. GCC Countries
        1. 3.7.3.1. GCC Countries Specialty Chemicals Market, 2016 – 2026 (USD Billion)
      4. 3.7.4. South Africa
        1. 3.7.4.1. South Africa Specialty Chemicals Market, 2016 – 2026 (USD Billion)
      5. 3.7.5. Rest of Middle-East Africa
        1. 3.7.5.1. Rest of Middle-East Africa Specialty Chemicals Market, 2016 – 2026 (USD Billion)
  4. Chapter 4 Specialty Chemicals Market – Competitive Landscape
    1. 4.1. Competitor Market Share – Revenue
    2. 4.2. Market Concentration Rate Analysis, Top 3 and Top 5 Players
    3. 4.3. Strategic Developments
      1. 4.3.1. Acquisitions and Mergers
      2. 4.3.2. New Products
      3. 4.3.3. Research & Development Activities
  5. Chapter 5 Company Profiles
    1. 5.1. Solvay AG
      1. 5.1.1. Company Overview
      2. 5.1.2. Product/Service Portfolio
      3. 5.1.3. Solvay AG Sales, Revenue, and Gross Margin
      4. 5.1.4. Solvay AG Revenue and Growth Rate
      5. 5.1.5. Solvay AG Market Share
      6. 5.1.6. Recent Initiatives, Funding/VC Activities, and Technological Innovations
    2. 5.2. Evonik Industries AG
      1. 5.2.1. Company Overview
      2. 5.2.2. Product/Service Portfolio
      3. 5.2.3. Evonik Industries AG Sales, Revenue, and Gross Margin
      4. 5.2.4. Evonik Industries AG Revenue and Growth Rate
      5. 5.2.5. Evonik Industries AG Market Share
      6. 5.2.6. Recent Initiatives, Funding/VC Activities, and Technological Innovations
    3. 5.3. Clariant AG
      1. 5.3.1. Company Overview
      2. 5.3.2. Product/Service Portfolio
      3. 5.3.3. Clariant AG Sales, Revenue, and Gross Margin
      4. 5.3.4. Clariant AG Revenue and Growth Rate
      5. 5.3.5. Clariant AG Market Share
      6. 5.3.6. Recent Initiatives, Funding/VC Activities, and Technological Innovations
    4. 5.4. Akzo Nobel N.V
      1. 5.4.1. Company Overview
      2. 5.4.2. Product/Service Portfolio
      3. 5.4.3. Akzo Nobel N.V Sales, Revenue, and Gross Margin
      4. 5.4.4. Akzo Nobel N.V Revenue and Growth Rate
      5. 5.4.5. Akzo Nobel N.V Market Share
      6. 5.4.6. Recent Initiatives, Funding/VC Activities, and Technological Innovations
    5. 5.5. BASF SE
      1. 5.5.1. Company Overview
      2. 5.5.2. Product/Service Portfolio
      3. 5.5.3. BASF SE Sales, Revenue, and Gross Margin
      4. 5.5.4. BASF SE Revenue and Growth Rate
      5. 5.5.5. BASF SE Market Share
      6. 5.5.6. Recent Initiatives, Funding/VC Activities, and Technological Innovations
    6. 5.6. Kemira Oyj
      1. 5.6.1. Company Overview
      2. 5.6.2. Product/Service Portfolio
      3. 5.6.3. Kemira Oyj Sales, Revenue, and Gross Margin
      4. 5.6.4. Kemira Oyj Revenue and Growth Rate
      5. 5.6.5. Kemira Oyj Market Share
      6. 5.6.6. Recent Initiatives, Funding/VC Activities, and Technological Innovations
    7. 5.7. LANXESS AG
      1. 5.7.1. Company Overview
      2. 5.7.2. Product/Service Portfolio
      3. 5.7.3. LANXESS AG Sales, Revenue, and Gross Margin
      4. 5.7.4. LANXESS AG Revenue and Growth Rate
      5. 5.7.5. LANXESS AG Market Share
      6. 5.7.6. Recent Initiatives, Funding/VC Activities, and Technological Innovations
    8. 5.8. Croda International plc
      1. 5.8.1. Company Overview
      2. 5.8.2. Product/Service Portfolio
      3. 5.8.3. Croda International plc Sales, Revenue, and Gross Margin
      4. 5.8.4. Croda International plc Revenue and Growth Rate
      5. 5.8.5. Croda International plc Market Share
      6. 5.8.6. Recent Initiatives, Funding/VC Activities, and Technological Innovations
    9. 5.9. Huntsman International LLC
      1. 5.9.1. Company Overview
      2. 5.9.2. Product/Service Portfolio
      3. 5.9.3. Huntsman International LLC Sales, Revenue, and Gross Margin
      4. 5.9.4. Huntsman International LLC Revenue and Growth Rate
      5. 5.9.5. Huntsman International LLC Market Share
      6. 5.9.6. Recent Initiatives, Funding/VC Activities, and Technological Innovations
    10. 5.10. The Lubrizol Corporation
      1. 5.10.1. Company Overview
      2. 5.10.2. Product/Service Portfolio
      3. 5.10.3. The Lubrizol Corporation Sales, Revenue, and Gross Margin
      4. 5.10.4. The Lubrizol Corporation Revenue and Growth Rate
      5. 5.10.5. The Lubrizol Corporation Market Share
      6. 5.10.6. Recent Initiatives, Funding/VC Activities, and Technological Innovations
    11. 5.11. Albemarle Corporation
      1. 5.11.1. Company Overview
      2. 5.11.2. Product/Service Portfolio
      3. 5.11.3. Albemarle Corporation Sales, Revenue, and Gross Margin
      4. 5.11.4. Albemarle Corporation Revenue and Growth Rate
      5. 5.11.5. Albemarle Corporation Market Share
      6. 5.11.6. Recent Initiatives, Funding/VC Activities, and Technological Innovations
    12. 5.12. Dow Inc
      1. 5.12.1. Company Overview
      2. 5.12.2. Product/Service Portfolio
      3. 5.12.3. Dow Inc Sales, Revenue, and Gross Margin
      4. 5.12.4. Dow Inc Revenue and Growth Rate
      5. 5.12.5. Dow Inc Market Share
      6. 5.12.6. Recent Initiatives, Funding/VC Activities, and Technological Innovations
    13. 5.13. Sumimoto Industries
      1. 5.13.1. Company Overview
      2. 5.13.2. Product/Service Portfolio
      3. 5.13.3. Sumimoto Industries Sales, Revenue, and Gross Margin
      4. 5.13.4. Sumimoto Industries Revenue and Growth Rate
      5. 5.13.5. Sumimoto Industries Market Share
      6. 5.13.6. Recent Initiatives, Funding/VC Activities, and Technological Innovations
    14. 5.14. Ashland LLC
      1. 5.14.1. Company Overview
      2. 5.14.2. Product/Service Portfolio
      3. 5.14.3. Ashland LLC Sales, Revenue, and Gross Margin
      4. 5.14.4. Ashland LLC Revenue and Growth Rate
      5. 5.14.5. Ashland LLC Market Share
      6. 5.14.6. Recent Initiatives, Funding/VC Activities, and Technological Innovations
    15. 5.15. Henkel Ag & Co KGAA.
      1. 5.15.1. Company Overview
      2. 5.15.2. Product/Service Portfolio
      3. 5.15.3. Henkel Ag & Co KGAA. Sales, Revenue, and Gross Margin
      4. 5.15.4. Henkel Ag & Co KGAA. Revenue and Growth Rate
      5. 5.15.5. Henkel Ag & Co KGAA. Market Share
      6. 5.15.6. Recent Initiatives, Funding/VC Activities, and Technological Innovations
    16. 5.16. 3M
      1. 5.16.1. Company Overview
      2. 5.16.2. Product/Service Portfolio
      3. 5.16.3. 3M Sales, Revenue, and Gross Margin
      4. 5.16.4. 3M Revenue and Growth Rate
      5. 5.16.5. 3M Market Share
      6. 5.16.6. Recent Initiatives, Funding/VC Activities, and Technological Innovations
  6. Chapter 6 Specialty Chemicals — Industry Analysis
    1. 6.1. Introduction and Taxonomy
    2. 6.2. Specialty Chemicals Market – Key Trends
      1. 6.2.1. Market Drivers
      2. 6.2.2. Market Restraints
      3. 6.2.3. Market Opportunities
    3. 6.3. Value Chain Analysis
    4. 6.4. Key Mandates and Regulations
    5. 6.5. Technology Roadmap and Timeline
    6. 6.6. Specialty Chemicals Market – Attractiveness Analysis
      1. 6.6.1. By Product
      2. 6.6.2. By Region
  7. Chapter 7 Industrial Chain, Sourcing Strategy, and Downstream Buyers
    1. 7.1. Specialty Chemicals Industrial Chain Analysis
    2. 7.2. Downstream Buyers
    3. 7.3. Distributors/Traders List
  8. Chapter 8 Marketing Strategy Analysis
    1. 8.1. Marketing Channel
    2. 8.2. Direct Marketing
    3. 8.3. Indirect Marketing
    4. 8.4. Marketing Channel Development Trends
    5. 8.5. Economic/Political Environmental Change
  9. Chapter 9 Report Conclusion & Key Insights
    1. 9.1. Key Insights from Primary Interviews & Surveys Respondents
    2. 9.2. Key Takeaways from Analysts, Consultants, and Industry Leaders
  10. Chapter 10 Research Approach & Methodology
    1. 10.1. Report Description
    2. 10.2. Research Scope
    3. 10.3. Research Methodology
      1. 10.3.1. Secondary Research
      2. 10.3.2. Primary Research
      3. 10.3.3. Statistical Models
        1. 10.3.3.1. Company Share Analysis Model
        2. 10.3.3.2. Revenue Based Modeling
      4. 10.3.4. Research Limitations

  • List of Figures

    Fig.1	Product Picture of Specialty Chemicals
    Fig.2	Global Specialty Chemicals Market, 2016 – 2026 (USD Billion)
    Fig.3	Global Specialty Chemicals Market Absolute Revenue Opportunity, 2016 – 2026 (USD Billion)
    Fig.4	Global Specialty Chemicals Market Incremental Revenue Opportunity, 2020 – 2026 (USD Billion)
    Fig.5	Global Specialty Chemicals Market Share, by Product, 2019 & 2026 (USD Billion)
    Fig.6	Global Specialty Polymers  Specialty Chemicals Market, 2016 – 2026 (USD Billion)
    Fig.7	Global Institutional & Industrial Cleaners Specialty Chemicals Market, 2016 – 2026 (USD Billion)
    Fig.8	Global Electronics Chemicals  Specialty Chemicals Market, 2016 – 2026 (USD Billion)
    Fig.9	Global Rubber Processing Chemicals Specialty Chemicals Market, 2016 – 2026 (USD Billion)
    Fig.10	Global Flavors & Fragrances Specialty Chemicals Market, 2016 – 2026 (USD Billion)
    Fig.11	Global Construction Chemicals Specialty Chemicals Market, 2016 – 2026 (USD Billion)
    Fig.12	Global Food & Feed Additives  Specialty Chemicals Market, 2016 – 2026 (USD Billion)
    Fig.13	Global Cosmetic Chemicals Specialty Chemicals Market, 2016 – 2026 (USD Billion)
    Fig.14	Global Oilfield Chemicals Specialty Chemicals Market, 2016 – 2026 (USD Billion)
    Fig.15	Global Mining Chemicals  Specialty Chemicals Market, 2016 – 2026 (USD Billion)
    Fig.16	Global Pharmaceutical & Nutraceutical Additives Specialty Chemicals Market, 2016 – 2026 (USD Billion)
    Fig.17	Global Plastic Additives Specialty Chemicals Market, 2016 – 2026 (USD Billion)
    Fig.18	Global Printing Inks  Specialty Chemicals Market, 2016 – 2026 (USD Billion)
    Fig.19	Global CASE (Coatings, Adhesives, Sealants, And Elastomers) Specialty Chemicals Market, 2016 – 2026 (USD Billion)
    Fig.20	Global Catalysts Specialty Chemicals Market, 2016 – 2026 (USD Billion)
    Fig.21	Global Water Treatment Chemicals Specialty Chemicals Market, 2016 – 2026 (USD Billion)
    Fig.22	Global Corrosion Inhibitors  Specialty Chemicals Market, 2016 – 2026 (USD Billion)
    Fig.23	Global Flame Retardants  Specialty Chemicals Market, 2016 – 2026 (USD Billion)
    Fig.24	Global Others Specialty Chemicals Market, 2016 – 2026 (USD Billion)
    Fig.25	Global Specialty Chemicals Market Share, by Region, 2019 & 2026 (USD Billion)
    Fig.26	North America Specialty Chemicals Market, 2016 – 2026 (USD Billion)
    Fig.27	U.S. Specialty Chemicals Market, 2016 – 2026 (USD Billion)
    Fig.28	Canada Specialty Chemicals Market, 2016 – 2026 (USD Billion)
    Fig.29	Europe Specialty Chemicals Market, 2016 – 2026 (USD Billion)
    Fig.30	Germany Specialty Chemicals Market, 2016 – 2026 (USD Billion)
    Fig.31	France Specialty Chemicals Market, 2016 – 2026 (USD Billion)
    Fig.32	U.K. Specialty Chemicals Market, 2016 – 2026 (USD Billion)
    Fig.33	Italy Specialty Chemicals Market, 2016 – 2026 (USD Billion)
    Fig.34	Spain Specialty Chemicals Market, 2016 – 2026 (USD Billion)
    Fig.35	Rest of Europe Specialty Chemicals Market, 2016 – 2026 (USD Billion)
    Fig.36	Asia Pacific Specialty Chemicals Market, 2016 – 2026 (USD Billion)
    Fig.37	China Specialty Chemicals Market, 2016 – 2026 (USD Billion)
    Fig.38	Japan Specialty Chemicals Market, 2016 – 2026 (USD Billion)
    Fig.39	India Specialty Chemicals Market, 2016 – 2026 (USD Billion)
    Fig.40	South  Korea Specialty Chemicals Market, 2016 – 2026 (USD Billion)
    Fig.41	South-East Asia Specialty Chemicals Market, 2016 – 2026 (USD Billion)
    Fig.42	Rest of Asia Pacific Specialty Chemicals Market, 2016 – 2026 (USD Billion)
    Fig.43	Latin America Specialty Chemicals Market, 2016 – 2026 (USD Billion)
    Fig.44	Brazil Specialty Chemicals Market, 2016 – 2026 (USD Billion)
    Fig.45	Mexico Specialty Chemicals Market, 2016 – 2026 (USD Billion)
    Fig.46	Rest of Latin America Specialty Chemicals Market, 2016 – 2026 (USD Billion)
    Fig.47	The Middle-East and Africa Specialty Chemicals Market, 2016 – 2026 (USD Billion)
    Fig.48	GCC Countries Specialty Chemicals Market, 2016 – 2026 (USD Billion)
    Fig.49	South Africa Specialty Chemicals Market, 2016 – 2026 (USD Billion)
    Fig.50	Rest of Middle-East Africa Specialty Chemicals Market, 2016 – 2026 (USD Billion)
    Fig.51	Competitor Market Share – Revenue
    Fig.52	Solvay AG Revenue and Growth Rate
    Fig.53	Solvay AG Market Share
    Fig.54	Evonik Industries AG Revenue and Growth Rate
    Fig.55	Evonik Industries AG Market Share
    Fig.56	Clariant AG Revenue and Growth Rate
    Fig.57	Clariant AG Market Share
    Fig.58	Akzo Nobel N.V Revenue and Growth Rate
    Fig.59	Akzo Nobel N.V Market Share
    Fig.60	BASF SE Revenue and Growth Rate
    Fig.61	BASF SE Market Share
    Fig.62	Kemira Oyj Revenue and Growth Rate
    Fig.63	Kemira Oyj Market Share
    Fig.64	LANXESS AG Revenue and Growth Rate
    Fig.65	LANXESS AG Market Share
    Fig.66	Croda International plc Revenue and Growth Rate
    Fig.67	Croda International plc Market Share
    Fig.68	Huntsman International LLC Revenue and Growth Rate
    Fig.69	Huntsman International LLC Market Share
    Fig.70	The Lubrizol Corporation Revenue and Growth Rate
    Fig.71	The Lubrizol Corporation Market Share
    Fig.72	Albemarle Corporation Revenue and Growth Rate
    Fig.73	Albemarle Corporation Market Share
    Fig.74	Dow Inc Revenue and Growth Rate
    Fig.75	Dow Inc Market Share
    Fig.76	Sumimoto Industries Revenue and Growth Rate
    Fig.77	Sumimoto Industries Market Share
    Fig.78	Ashland LLC Revenue and Growth Rate
    Fig.79	Ashland LLC Market Share
    Fig.80	Henkel Ag & Co KGAA. Revenue and Growth Rate
    Fig.81	Henkel Ag & Co KGAA. Market Share
    Fig.82	3M Revenue and Growth Rate
    Fig.83	3M Market Share
    Fig.84	Market Dynamics
    Fig.85	Global Specialty Chemicals – Value Chain Analysis
    Fig.86	Key Mandates and Regulations
    Fig.87	Technology Roadmap and Timeline
    Fig.88	Market Attractiveness Analysis – By Product
    Fig.89	Market Attractiveness Analysis – By Region
    Fig.90	Specialty Chemicals Industrial Chain Analysis
    Fig.91	Market Channels
    Fig.92	Marketing Channel Development Trend
    Fig.93	Growth in World Gross Product, 2008-2018
    

    List of Tables

    Table 1	Global Specialty Chemicals Market, 2019 & 2026 (USD Billion)
    Table 2	Global Specialty Chemicals Market, by Product, 2016 – 2026 (USD Billion)
    Table 3	Global Specialty Chemicals Market, by Region, 2016 – 2026 (USD Billion)
    Table 4	North America Specialty Chemicals Market, by Country, 2016 – 2026 (USD Billion)
    Table 5	North America Specialty Chemicals Market, by Product, 2016 – 2026 (USD Billion)
    Table 6	Europe Specialty Chemicals Market, by Country, 2016 – 2026 (USD Billion)
    Table 7	Europe Specialty Chemicals Market, by Product, 2016 – 2026 (USD Billion)
    Table 8	Asia Pacific Specialty Chemicals Market, by Country, 2016 – 2026 (USD Billion)
    Table 9 Asia Pacific Specialty Chemicals Market, by Product, 2016 – 2026 (USD Billion)
    Table 10 Latin America Specialty Chemicals Market, by Country, 2016 – 2026 (USD Billion)
    Table 11 Latin America Specialty Chemicals Market, by Product, 2016 – 2026 (USD Billion)
    Table 12 The Middle-East and Africa Specialty Chemicals Market, by Country, 2016 – 2026 (USD Billion)
    Table 13 The Middle-East and Africa Specialty Chemicals Market, by Product, 2016 – 2026 (USD Billion)
    Table 14 Global Specialty Chemicals Market - Company Revenue Analysis, 2016 – 2019 (USD Billion)
    Table 15 Global Specialty Chemicals Market - Company Revenue Share Analysis, 2016 – 2019 (%)
    Table 16 Acquisitions and Mergers
    Table 17 Market Drivers – Impact Analysis
    Table 18 Market Restraints
    Table 19 Market Opportunities
    Table 20 Major Buyers of Specialty Chemicals
    Table 21 Distributors/Traders of Specialty Chemicals by Region
    
  •  

    Industry Major Market Players

    • Solvay AG
    • Evonik Industries AG
    • Clariant AG
    • Akzo Nobel N.V.
    • BASF SE
    • Kemira Oyj
    • LANXESS AG
    • Croda International plc.
    • Huntsman International LLC
    • The Lubrizol Corporation
    • Albemarle Corporation
    • Dow Inc.
    • Sumimoto Industries
    • Ashland LLC
    • Henkel Ag & Co KGAA.
    • 3M