Search Market Research Report

Discover Our Latest Reports
Discover Our Featured Reports
Discover Top Selling Reports

Healthcare Chatbots Market Size, Share Global Analysis Report, 2021 – 2026

report img

Healthcare Chatbots Market By Component (Software & Services), By Deployment Mode (On-Premises & Cloud-Based), By Application (Symptom Checking, Medication Assistance, Appointment Scheduling, & Medical Guidance), By End User (Patients, Healthcare Providers, Insurance Companies, & Others), And By Regions - Global & Regional Industry Perspective, Comprehensive Analysis, and Forecast 2021 – 2026

Industry Insights

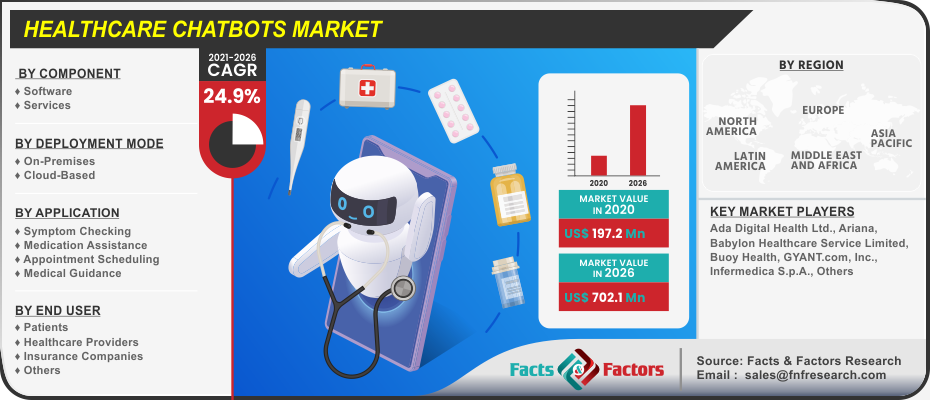
[227+ pages Report] The latest finding surrounding the Global Healthcare Chatbots Market published by Facts & Factors offers a neatly packaged and comprehensive read. In this report, the global healthcare chatbots market is expected to reach a projected value of USD 702.1 Million by 2026 with a growth rate of 24.9% CAGR from an initial value of  USD 197.2 Million in the year of 2020.

logoMarket Overview

Healthcare chatbots are destined PC programs that have the ability to trigger a human-like connection or discussion with the aid of computerized reasoning or purview. The current generation of healthcare-related chatbots responds as if an actual human is present on the other side with innovative solutions and a serious coding outlook. These chatbots often rely upon the utilization of web-based solutions which make the possibility of executing them from one side of the planet to another.

logoIndustry Growth Factors

The global healthcare chatbots market is expected to register a higher market value during the advent of the forecast period owing to rising internet connectivity measures owing to a higher rate of smart device adoption coupled with increasing company initiatives to boost an increased usage of healthcare chatbots to name a few. Additionally, rising needs and demands from virtual health assistive methods coupled with the rising integration of social media-based chatbots will increase the footprint of the global healthcare chatbots market during the advent of the forecast period. Moreover, rising cloud-based models coupled with the increasing inclination of rising trust among users toward these chatbots will boost the growth of the global healthcare chatbots market during the advent of the forecast period.

The global healthcare chatbots market is driven by increased adoption of IoT-based measures coupled with rising measures of advanced technologies such as ML and neural network-based approaches to name a few. Factors pertaining to the increasing number of smartphones coupled with the latter becoming more user-friendly and informative will fuel the growth of the global healthcare chatbots market during the advent of the forecast period. However, concerns regarding data privacy measures, lack of an expert skilled workforce, and lack of awareness and increasing misconceptions will hamper the growth of the global healthcare chatbots market during the advent of the forecast period.

Healthcare Chatbots Market

To know more about this report | Request Free Sample Copy

logoSegmentation Analysis

The global healthcare chatbots market is segmented into component, deployment model, application, end-user, and region.

The global healthcare chatbots market is divided into software and services on the basis of components. The software segment is expected to witness the largest market share during the advent of the forecast period owing to the latter being pertaining to chatbot solutions coupled with a subscription-based payment mode to name a few. Based on deployment mode, the global healthcare chatbots market is bifurcated into on-premises and cloud-based. The segment pertaining to cloud-based deployment is expected to witness the largest market share during the advent of the forecast period owing to less initial investment costs coupled with more accessibility options and less customizable solutions toward setting up to name a few. Based on application, the global healthcare chatbots market is fragmented into symptom checking, medication assistance, appointment scheduling, and medical guidance. The segment pertaining to symptom checking is expected to witness the largest market share during the advent of the forecast period owing to the rising adoption of smartphones and increased internet connectivity measures to name a few. The global healthcare chatbots market is classified into patients, healthcare providers, insurance companies, and others on the basis of end-user. The segment pertaining to patients is expected to witness the largest market share during the advent of the forecast period owing to the rising need for self-monitoring approaches coupled with increasing awareness among consumers to name a few.

logo Report Scope

Report Attribute

Details

Market Size in 2020

USD 197.2 Million

Projected Market Size in 2026

USD 702.1 Million

CAGR Growth Rate

24.9% CAGR

Base Year

2020

Forecast Years

2021-2026

Key Market Players

Ada Digital Health Ltd., Ariana, Babylon Healthcare Service Limited, Buoy Health, GYANT.com, Inc., Infermedica S.p.A., Microsoft Corporation, PACT Care B.V., Sense.ly, Inc., Your.MD., Woebot, HealthTap, Inc., Baidu, Inc., and COM, Inc., among others.

Key Segments

Component, Deployment Mode, Application, End User, and Region

Major Regions Covered

North America, Europe, Asia Pacific, Latin America, and Middle East & Africa

Purchase Options

Request customized purchase options to meet your research needs. Explore purchase options

logo Regional Analysis

North America is expected to witness the largest market share during the advent of the forecast period owing to increased usage among the users in terms of mobile phone usage for gathering healthcare information coupled with a broadening usage of social media-based chatbots to name a few. Additionally, rising investment opportunities in the latter sector coupled with longer patient waiting times are expected to increase the footprint of the healthcare chatbots market during the advent of the forecast period. Factors such as increasing collaborations among the key market participants coupled with the rising number of government-based initiatives for tightening the healthcare sector will boost the growth of the healthcare chatbots market during the advent of the forecast period. The region of Asia-Pacific is expected to witness the fastest growing CAGR during the advent of the forecast period owing to a surge of embedding measures pertaining to healthcare chatbots coupled with a constantly evolving life science industry from emerging sectors such as India, China, and Malaysia to name a few.

logo Competitive Players

The key market participants for the global healthcare chatbots market are :

  • Ada Digital Health Ltd.
  • Ariana
  • Babylon Healthcare Service Limited
  • Buoy Health
  • GYANT.com Inc.
  • Infermedica S.p.A.
  • Microsoft Corporation
  • PACT Care B.V.
  • Sense.ly Inc.
  • Your.MD.
  • Woebot
  • HealthTap Inc.
  • Baidu Inc.
  • COM Inc.

logo By Component Segment Analysis

  • Software
  • Services

logo By Deployment Mode Segment Analysis

  • On-Premises
  • Cloud-Based

logo By Application Segment Analysis

  • Symptom Checking
  • Medication Assistance
  • Appointment Scheduling
  • Medical Guidance

logo By End User Segment Analysis

  • Patients
  • Healthcare Providers
  • Insurance Companies
  • Others

logo By Regional Segment Analysis

  • North America
    • U.S.
    • Canada
  • Europe
    • UK
    • France
    • Germany
    • Italy
    • Spain
    • Rest of Europe
  • Asia Pacific
    • China
    • Japan
    • India
    • South Korea
    • Southeast Asia
    • Rest of Asia Pacific
  • Latin America
    • Brazil
    • Mexico
    • Rest of Latin America
  • Middle East and Africa
    • GCC Countries
    • South Africa
    • Rest of MEA

Table of Content

  1. Chapter 1 Executive Summary
    1. 1.1. Introduction of Healthcare Chatbots
    2. 1.2. Global Healthcare Chatbots Market, 2019 & 2026 (USD Million)
    3. 1.3. Global Healthcare Chatbots Market, 2016 – 2026 (USD Million)
    4. 1.4. Global Healthcare Chatbots Market Absolute Revenue Opportunity, 2016 – 2026 (USD Million)
    5. 1.5. Global Healthcare Chatbots Market Incremental Revenue Opportunity, 2020 – 2026 (USD Million)
  2. Chapter 2 Healthcare Chatbots Market – Component Analysis
    1. 2.1. Global Healthcare Chatbots Market – Component Overview
    2. 2.2. Global Healthcare Chatbots Market Share, by Component, 2019 & 2026 (USD Million)
    3. 2.3. Software
      1. 2.3.1. Global Software Healthcare Chatbots Market, 2016 – 2026 (USD Million)
    4. 2.4. Services
      1. 2.4.1. Global Services Healthcare Chatbots Market, 2016 – 2026 (USD Million)
  3. Chapter 3 Healthcare Chatbots Market – Deployment Mode Analysis
    1. 3.1. Global Healthcare Chatbots Market – Deployment Mode Overview
    2. 3.2. Global Healthcare Chatbots Market Share, by Deployment Mode, 2019 & 2026 (USD Million)
    3. 3.3. On-Premises
      1. 3.3.1. Global On-Premises Healthcare Chatbots Market, 2016 – 2026 (USD Million)
    4. 3.4. Cloud-Based
      1. 3.4.1. Global Cloud-Based Healthcare Chatbots Market, 2016 – 2026 (USD Million)
  4. Chapter 4 Healthcare Chatbots Market – Application Analysis
    1. 4.1. Global Healthcare Chatbots Market – Application Overview
    2. 4.2. Global Healthcare Chatbots Market Share, by Application, 2019 & 2026 (USD Million)
    3. 4.3. Symptom Checking
      1. 4.3.1. Global Symptom Checking Healthcare Chatbots Market, 2016 – 2026 (USD Million)
    4. 4.4. Medication Assistance
      1. 4.4.1. Global Medication Assistance Healthcare Chatbots Market, 2016 – 2026 (USD Million)
    5. 4.5. Appointment Scheduling
      1. 4.5.1. Global Appointment Scheduling Healthcare Chatbots Market, 2016 – 2026 (USD Million)
    6. 4.6. Medical Guidance
      1. 4.6.1. Global Medical Guidance Healthcare Chatbots Market, 2016 – 2026 (USD Million)
  5. Chapter 5 Healthcare Chatbots Market – End User Analysis
    1. 5.1. Global Healthcare Chatbots Market – End User Overview
    2. 5.2. Global Healthcare Chatbots Market Share, by End User, 2019 & 2026 (USD Million)
    3. 5.3. Patients
      1. 5.3.1. Global Patients Healthcare Chatbots Market, 2016 – 2026 (USD Million)
    4. 5.4. Healthcare Providers
      1. 5.4.1. Global Healthcare Providers Healthcare Chatbots Market, 2016 – 2026 (USD Million)
    5. 5.5. Insurance Companies
      1. 5.5.1. Global Insurance Companies Healthcare Chatbots Market, 2016 – 2026 (USD Million)
    6. 5.6. Others
      1. 5.6.1. Global Others Healthcare Chatbots Market, 2016 – 2026 (USD Million)
  6. Chapter 6 Healthcare Chatbots Market – Regional Analysis
    1. 6.1. Global Healthcare Chatbots Market Regional Overview
    2. 6.2. Global Healthcare Chatbots Market Share, by Region, 2019 & 2026 (USD Million)
    3. 6.3. North America
      1. 6.3.1. North America Healthcare Chatbots Market, 2016 – 2026 (USD Million)
        1. 6.3.1.1. North America Healthcare Chatbots Market, by Country, 2016 - 2026 (USD Million)
      2. 6.3.2. North America Healthcare Chatbots Market, by Component, 2016 – 2026
        1. 6.3.2.1. North America Healthcare Chatbots Market, by Component, 2016 – 2026 (USD Million)
      3. 6.3.3. North America Healthcare Chatbots Market, by Deployment Mode, 2016 – 2026
        1. 6.3.3.1. North America Healthcare Chatbots Market, by Deployment Mode, 2016 – 2026 (USD Million)
      4. 6.3.4. North America Healthcare Chatbots Market, by Application, 2016 – 2026
        1. 6.3.4.1. North America Healthcare Chatbots Market, by Application, 2016 – 2026 (USD Million)
      5. 6.3.5. North America Healthcare Chatbots Market, by End User, 2016 – 2026
        1. 6.3.5.1. North America Healthcare Chatbots Market, by End User, 2016 – 2026 (USD Million)
      6. 6.3.6. U.S.
        1. 6.3.6.1. U.S. Healthcare Chatbots Market, 2016 – 2026 (USD Million)
      7. 6.3.7. Canada
        1. 6.3.7.1. Canada Healthcare Chatbots Market, 2016 – 2026 (USD Million)
    4. 6.4. Europe
      1. 6.4.1. Europe Healthcare Chatbots Market, 2016 – 2026 (USD Million)
        1. 6.4.1.1. Europe Healthcare Chatbots Market, by Country, 2016 - 2026 (USD Million)
      2. 6.4.2. Europe Healthcare Chatbots Market, by Component, 2016 – 2026
        1. 6.4.2.1. Europe Healthcare Chatbots Market, by Component, 2016 – 2026 (USD Million)
      3. 6.4.3. Europe Healthcare Chatbots Market, by Deployment Mode, 2016 – 2026
        1. 6.4.3.1. Europe Healthcare Chatbots Market, by Deployment Mode, 2016 – 2026 (USD Million)
      4. 6.4.4. Europe Healthcare Chatbots Market, by Application, 2016 – 2026
        1. 6.4.4.1. Europe Healthcare Chatbots Market, by Application, 2016 – 2026 (USD Million)
      5. 6.4.5. Europe Healthcare Chatbots Market, by End User, 2016 – 2026
        1. 6.4.5.1. Europe Healthcare Chatbots Market, by End User, 2016 – 2026 (USD Million)
      6. 6.4.6. Germany
        1. 6.4.6.1. Germany Healthcare Chatbots Market, 2016 – 2026 (USD Million)
      7. 6.4.7. France
        1. 6.4.7.1. France Healthcare Chatbots Market, 2016 – 2026 (USD Million)
      8. 6.4.8. U.K.
        1. 6.4.8.1. U.K. Healthcare Chatbots Market, 2016 – 2026 (USD Million)
      9. 6.4.9. Italy
        1. 6.4.9.1. Italy Healthcare Chatbots Market, 2016 – 2026 (USD Million)
      10. 6.4.10. Spain
        1. 6.4.10.1. Spain Healthcare Chatbots Market, 2016 – 2026 (USD Million)
      11. 6.4.11. Rest of Europe
        1. 6.4.11.1. Rest of Europe Healthcare Chatbots Market, 2016 – 2026 (USD Million)
    5. 6.5. Asia Pacific
      1. 6.5.1. Asia Pacific Healthcare Chatbots Market, 2016 – 2026 (USD Million)
        1. 6.5.1.1. Asia Pacific Healthcare Chatbots Market, by Country, 2016 - 2026 (USD Million)
      2. 6.5.2. Asia Pacific Healthcare Chatbots Market, by Component, 2016 – 2026
        1. 6.5.2.1. Asia Pacific Healthcare Chatbots Market, by Component, 2016 – 2026 (USD Million)
      3. 6.5.3. Asia Pacific Healthcare Chatbots Market, by Deployment Mode, 2016 – 2026
        1. 6.5.3.1. Asia Pacific Healthcare Chatbots Market, by Deployment Mode, 2016 – 2026 (USD Million)
      4. 6.5.4. Asia Pacific Healthcare Chatbots Market, by Application, 2016 – 2026
        1. 6.5.4.1. Asia Pacific Healthcare Chatbots Market, by Application, 2016 – 2026 (USD Million)
      5. 6.5.5. Asia Pacific Healthcare Chatbots Market, by End User, 2016 – 2026
        1. 6.5.5.1. Asia Pacific Healthcare Chatbots Market, by End User, 2016 – 2026 (USD Million)
      6. 6.5.6. China
        1. 6.5.6.1. China Healthcare Chatbots Market, 2016 – 2026 (USD Million)
      7. 6.5.7. Japan
        1. 6.5.7.1. Japan Healthcare Chatbots Market, 2016 – 2026 (USD Million)
      8. 6.5.8. India
        1. 6.5.8.1. India Healthcare Chatbots Market, 2016 – 2026 (USD Million)
      9. 6.5.9. South Korea
        1. 6.5.9.1. South Korea Healthcare Chatbots Market, 2016 – 2026 (USD Million)
      10. 6.5.10. South-East Asia
        1. 6.5.10.1. South-East Asia Healthcare Chatbots Market, 2016 – 2026 (USD Million)
      11. 6.5.11. Rest of Asia Pacific
        1. 6.5.11.1. Rest of Asia Pacific Healthcare Chatbots Market, 2016 – 2026 (USD Million)
    6. 6.6. Latin America
      1. 6.6.1. Latin America Healthcare Chatbots Market, 2016 – 2026 (USD Million)
        1. 6.6.1.1. Latin America Healthcare Chatbots Market, by Country, 2016 - 2026 (USD Million)
      2. 6.6.2. Latin America Healthcare Chatbots Market, by Component, 2016 – 2026
        1. 6.6.2.1. Latin America Healthcare Chatbots Market, by Component, 2016 – 2026 (USD Million)
      3. 6.6.3. Latin America Healthcare Chatbots Market, by Deployment Mode, 2016 – 2026
        1. 6.6.3.1. Latin America Healthcare Chatbots Market, by Deployment Mode, 2016 – 2026 (USD Million)
      4. 6.6.4. Latin America Healthcare Chatbots Market, by Application, 2016 – 2026
        1. 6.6.4.1. Latin America Healthcare Chatbots Market, by Application, 2016 – 2026 (USD Million)
      5. 6.6.5. Latin America Healthcare Chatbots Market, by End User, 2016 – 2026
        1. 6.6.5.1. Latin America Healthcare Chatbots Market, by End User, 2016 – 2026 (USD Million)
      6. 6.6.6. Brazil
        1. 6.6.6.1. Brazil Healthcare Chatbots Market, 2016 – 2026 (USD Million)
      7. 6.6.7. Mexico
        1. 6.6.7.1. Mexico Healthcare Chatbots Market, 2016 – 2026 (USD Million)
      8. 6.6.8. Rest of Latin America
        1. 6.6.8.1. Rest of Latin America Healthcare Chatbots Market, 2016 – 2026 (USD Million)
    7. 6.7. The Middle-East and Africa
      1. 6.7.1. The Middle-East and Africa Healthcare Chatbots Market, 2016 – 2026 (USD Million)
        1. 6.7.1.1. The Middle-East and Africa Healthcare Chatbots Market, by Country, 2016 - 2026 (USD Million)
      2. 6.7.2. The Middle-East and Africa Healthcare Chatbots Market, by Component, 2016 – 2026
        1. 6.7.2.1. The Middle-East and Africa Healthcare Chatbots Market, by Component, 2016 – 2026 (USD Million)
      3. 6.7.3. The Middle-East and Africa Healthcare Chatbots Market, by Deployment Mode, 2016 – 2026
        1. 6.7.3.1. The Middle-East and Africa Healthcare Chatbots Market, by Deployment Mode, 2016 – 2026 (USD Million)
      4. 6.7.4. The Middle-East and Africa Healthcare Chatbots Market, by Application, 2016 – 2026
        1. 6.7.4.1. The Middle-East and Africa Healthcare Chatbots Market, by Application, 2016 – 2026 (USD Million)
      5. 6.7.5. The Middle-East and Africa Healthcare Chatbots Market, by End User, 2016 – 2026
        1. 6.7.5.1. The Middle-East and Africa Healthcare Chatbots Market, by End User, 2016 – 2026 (USD Million)
      6. 6.7.6. GCC Countries
        1. 6.7.6.1. GCC Countries Healthcare Chatbots Market, 2016 – 2026 (USD Million)
      7. 6.7.7. South Africa
        1. 6.7.7.1. South Africa Healthcare Chatbots Market, 2016 – 2026 (USD Million)
      8. 6.7.8. Rest of Middle-East Africa
        1. 6.7.8.1. Rest of Middle-East Africa Healthcare Chatbots Market, 2016 – 2026 (USD Million)
  7. Chapter 7 Healthcare Chatbots Market – Competitive Landscape
    1. 7.1. Competitor Market Share – Revenue
    2. 7.2. Market Concentration Rate Analysis, Top 3 and Top 5 Players
    3. 7.3. Strategic Developments
      1. 7.3.1. Acquisitions and Mergers
      2. 7.3.2. New Products
      3. 7.3.3. Research & Development Activities
  8. Chapter 8 Company Profiles
    1. 8.1. Ada Digital Health Ltd
      1. 8.1.1. Company Overview
      2. 8.1.2. Product/Service Portfolio
      3. 8.1.3. Ada Digital Health Ltd Sales, Revenue, and Gross Margin
      4. 8.1.4. Ada Digital Health Ltd Revenue and Growth Rate
      5. 8.1.5. Ada Digital Health Ltd Market Share
      6. 8.1.6. Recent Initiatives, Funding/VC Activities, and Technological Innovations
    2. 8.2. Ariana
      1. 8.2.1. Company Overview
      2. 8.2.2. Product/Service Portfolio
      3. 8.2.3. Ariana Sales, Revenue, and Gross Margin
      4. 8.2.4. Ariana Revenue and Growth Rate
      5. 8.2.5. Ariana Market Share
      6. 8.2.6. Recent Initiatives, Funding/VC Activities, and Technological Innovations
    3. 8.3. Babylon Healthcare Service Limited
      1. 8.3.1. Company Overview
      2. 8.3.2. Product/Service Portfolio
      3. 8.3.3. Babylon Healthcare Service Limited Sales, Revenue, and Gross Margin
      4. 8.3.4. Babylon Healthcare Service Limited Revenue and Growth Rate
      5. 8.3.5. Babylon Healthcare Service Limited Market Share
      6. 8.3.6. Recent Initiatives, Funding/VC Activities, and Technological Innovations
    4. 8.4. Buoy Health
      1. 8.4.1. Company Overview
      2. 8.4.2. Product/Service Portfolio
      3. 8.4.3. Buoy Health Sales, Revenue, and Gross Margin
      4. 8.4.4. Buoy Health Revenue and Growth Rate
      5. 8.4.5. Buoy Health Market Share
      6. 8.4.6. Recent Initiatives, Funding/VC Activities, and Technological Innovations
      7. 8.5. GYANT.com Inc
      8. 8.5.1. Company Overview
      9. 8.5.2. Product/Service Portfolio
        1. 8.5.3. GYANT.com Inc Sales, Revenue, and Gross Margin
        2. 8.5.4. GYANT.com Inc Revenue and Growth Rate
        3. 8.5.5. GYANT.com Inc Market Share
      10. 8.5.6. Recent Initiatives, Funding/VC Activities, and Technological Innovations
    5. 8.6. Infermedica S.p.A
      1. 8.6.1. Company Overview
      2. 8.6.2. Product/Service Portfolio
      3. 8.6.3. Infermedica S.p.A Sales, Revenue, and Gross Margin
      4. 8.6.4. Infermedica S.p.A Revenue and Growth Rate
      5. 8.6.5. Infermedica S.p.A Market Share
      6. 8.6.6. Recent Initiatives, Funding/VC Activities, and Technological Innovations
    6. 8.7. Microsoft Corporation
      1. 8.7.1. Company Overview
      2. 8.7.2. Product/Service Portfolio
      3. 8.7.3. Microsoft Corporation Sales, Revenue, and Gross Margin
      4. 8.7.4. Microsoft Corporation Revenue and Growth Rate
      5. 8.7.5. Microsoft Corporation Market Share
      6. 8.7.6. Recent Initiatives, Funding/VC Activities, and Technological Innovations
    7. 8.8. PACT Care B.V
      1. 8.8.1. Company Overview
      2. 8.8.2. Product/Service Portfolio
      3. 8.8.3. PACT Care B.V Sales, Revenue, and Gross Margin
      4. 8.8.4. PACT Care B.V Revenue and Growth Rate
      5. 8.8.5. PACT Care B.V Market Share
      6. 8.8.6. Recent Initiatives, Funding/VC Activities, and Technological Innovations
      7. 8.9. Sense.ly Inc
      8. 8.9.1. Company Overview
      9. 8.9.2. Product/Service Portfolio
        1. 8.9.3. Sense.ly Inc Sales, Revenue, and Gross Margin
        2. 8.9.4. Sense.ly Inc Revenue and Growth Rate
        3. 8.9.5. Sense.ly Inc Market Share
      10. 8.9.6. Recent Initiatives, Funding/VC Activities, and Technological Innovations
      11. 8.10. Your.MD
      12. 8.10.1. Company Overview
      13. 8.10.2. Product/Service Portfolio
        1. 8.10.3. Your.MD Sales, Revenue, and Gross Margin
        2. 8.10.4. Your.MD Revenue and Growth Rate
        3. 8.10.5. Your.MD Market Share
      14. 8.10.6. Recent Initiatives, Funding/VC Activities, and Technological Innovations
    8. 8.11. Woebot
      1. 8.11.1. Company Overview
      2. 8.11.2. Product/Service Portfolio
      3. 8.11.3. Woebot Sales, Revenue, and Gross Margin
      4. 8.11.4. Woebot Revenue and Growth Rate
      5. 8.11.5. Woebot Market Share
      6. 8.11.6. Recent Initiatives, Funding/VC Activities, and Technological Innovations
    9. 8.12. HealthTap Inc
      1. 8.12.1. Company Overview
      2. 8.12.2. Product/Service Portfolio
      3. 8.12.3. HealthTap Inc Sales, Revenue, and Gross Margin
      4. 8.12.4. HealthTap Inc Revenue and Growth Rate
      5. 8.12.5. HealthTap Inc Market Share
      6. 8.12.6. Recent Initiatives, Funding/VC Activities, and Technological Innovations
    10. 8.13. Baidu Inc
      1. 8.13.1. Company Overview
      2. 8.13.2. Product/Service Portfolio
      3. 8.13.3. Baidu Inc Sales, Revenue, and Gross Margin
      4. 8.13.4. Baidu Inc Revenue and Growth Rate
      5. 8.13.5. Baidu Inc Market Share
      6. 8.13.6. Recent Initiatives, Funding/VC Activities, and Technological Innovations
    11. 8.14. COM Inc
      1. 8.14.1. Company Overview
      2. 8.14.2. Product/Service Portfolio
      3. 8.14.3. COM Inc Sales, Revenue, and Gross Margin
      4. 8.14.4. COM Inc Revenue and Growth Rate
      5. 8.14.5. COM Inc Market Share
      6. 8.14.6. Recent Initiatives, Funding/VC Activities, and Technological Innovations
  9. Chapter 9 Healthcare Chatbots — Industry Analysis
    1. 9.1. Introduction and Taxonomy
    2. 9.2. Healthcare Chatbots Market – Key Trends
      1. 9.2.1. Market Drivers
      2. 9.2.2. Market Restraints
      3. 9.2.3. Market Opportunities
    3. 9.3. Value Chain Analysis
    4. 9.4. Key Mandates and Regulations
    5. 9.5. Technology Roadmap and Timeline
    6. 9.6. Healthcare Chatbots Market – Attractiveness Analysis
      1. 9.6.1. By Component
      2. 9.6.2. By Deployment Mode
      3. 9.6.3. By Application
      4. 9.6.4. By End User
      5. 9.6.5. By Region
  10. Chapter 10 Industrial Chain, Sourcing Strategy, and Downstream Buyers
    1. 10.1. Healthcare Chatbots Industrial Chain Analysis
    2. 10.2. Downstream Buyers
    3. 10.3. Distributors/Traders List
  11. Chapter 11 Marketing Strategy Analysis
    1. 11.1. Marketing Channel
    2. 11.2. Direct Marketing
    3. 11.3. Indirect Marketing
    4. 11.4. Marketing Channel Development Trends
    5. 11.5. Economic/Political Environmental Change
  12. Chapter 12 Report Conclusion & Key Insights
    1. 12.1. Key Insights from Primary Interviews & Surveys Respondents
    2. 12.2. Key Takeaways from Analysts, Consultants, and Industry Leaders
  13. Chapter 13 Research Approach & Methodology
    1. 13.1. Report Description
    2. 13.2. Research Scope
    3. 13.3. Research Methodology
      1. 13.3.1. Secondary Research
      2. 13.3.2. Primary Research
      3. 13.3.3. Statistical Models
        1. 13.3.3.1. Company Share Analysis Model
        2. 13.3.3.2. Revenue Based Modeling
      4. 13.3.4. Research Limitations

      List of Figures

      Fig.1	Product Picture of Healthcare Chatbots
      Fig.2	Global Healthcare Chatbots Market, 2016 – 2026 (USD Million)
      Fig.3	Global Healthcare Chatbots Market Absolute Revenue Opportunity, 2016 – 2026 (USD Million)
      Fig.4	Global Healthcare Chatbots Market Incremental Revenue Opportunity, 2020 – 2026 (USD Million)
      Fig.5	Global Healthcare Chatbots Market Share, by Component, 2019 & 2026 (USD Million)
      Fig.6	Global Software Healthcare Chatbots Market, 2016 – 2026 (USD Million)
      Fig.7	Global Services Healthcare Chatbots Market, 2016 – 2026 (USD Million)
      Fig.8	Global Healthcare Chatbots Market Share, by Deployment Mode, 2019 & 2026 (USD Million)
      Fig.9	Global On-Premises  Healthcare Chatbots Market, 2016 – 2026 (USD Million)
      Fig.10	Global Cloud-Based Healthcare Chatbots Market, 2016 – 2026 (USD Million)
      Fig.11	Global Healthcare Chatbots Market Share, by Application, 2019 & 2026 (USD Million)
      Fig.12	Global Symptom Checking  Healthcare Chatbots Market, 2016 – 2026 (USD Million)
      Fig.13	Global Medication Assistance  Healthcare Chatbots Market, 2016 – 2026 (USD Million)
      Fig.14	Global Appointment Scheduling Healthcare Chatbots Market, 2016 – 2026 (USD Million)
      Fig.15	Global Medical Guidance Healthcare Chatbots Market, 2016 – 2026 (USD Million)
      Fig.16	Global Healthcare Chatbots Market Share, by End User, 2019 & 2026 (USD Million)
      Fig.17	Global Patients  Healthcare Chatbots Market, 2016 – 2026 (USD Million)
      Fig.18	Global Healthcare Providers Healthcare Chatbots Market, 2016 – 2026 (USD Million)
      Fig.19	Global Insurance Companies Healthcare Chatbots Market, 2016 – 2026 (USD Million)
      Fig.20	Global Others Healthcare Chatbots Market, 2016 – 2026 (USD Million)
      Fig.21	Global Healthcare Chatbots Market Share, by Region, 2019 & 2026 (USD Million)
      Fig.22	North America Healthcare Chatbots Market, 2016 – 2026 (USD Million)
      Fig.23	U.S. Healthcare Chatbots Market, 2016 – 2026 (USD Million)
      Fig.24	Canada Healthcare Chatbots Market, 2016 – 2026 (USD Million)
      Fig.25	Europe Healthcare Chatbots Market, 2016 – 2026 (USD Million)
      Fig.26	Germany Healthcare Chatbots Market, 2016 – 2026 (USD Million)
      Fig.27	France Healthcare Chatbots Market, 2016 – 2026 (USD Million)
      Fig.28	U.K. Healthcare Chatbots Market, 2016 – 2026 (USD Million)
      Fig.29	Italy Healthcare Chatbots Market, 2016 – 2026 (USD Million)
      Fig.30	Spain Healthcare Chatbots Market, 2016 – 2026 (USD Million)
      Fig.31	Rest of Europe Healthcare Chatbots Market, 2016 – 2026 (USD Million)
      Fig.32	Asia Pacific Healthcare Chatbots Market, 2016 – 2026 (USD Million)
      Fig.33	China Healthcare Chatbots Market, 2016 – 2026 (USD Million)
      Fig.34	Japan Healthcare Chatbots Market, 2016 – 2026 (USD Million)
      Fig.35	India Healthcare Chatbots Market, 2016 – 2026 (USD Million)
      Fig.36	South  Korea Healthcare Chatbots Market, 2016 – 2026 (USD Million)
      Fig.37	South-East Asia Healthcare Chatbots Market, 2016 – 2026 (USD Million)
      Fig.38	Rest of Asia Pacific Healthcare Chatbots Market, 2016 – 2026 (USD Million)
      Fig.39	Latin America Healthcare Chatbots Market, 2016 – 2026 (USD Million)
      Fig.40	Brazil Healthcare Chatbots Market, 2016 – 2026 (USD Million)
      Fig.41	Mexico Healthcare Chatbots Market, 2016 – 2026 (USD Million)
      Fig.42	Rest of Latin America Healthcare Chatbots Market, 2016 – 2026 (USD Million)
      Fig.43	The Middle-East and Africa Healthcare Chatbots Market, 2016 – 2026 (USD Million)
      Fig.44	GCC Countries Healthcare Chatbots Market, 2016 – 2026 (USD Million)
      Fig.45	South Africa Healthcare Chatbots Market, 2016 – 2026 (USD Million)
      Fig.46	Rest of Middle-East Africa Healthcare Chatbots Market, 2016 – 2026 (USD Million)
      Fig.47	Competitor Market Share – Revenue
      Fig.48	Ada Digital Health Ltd Revenue and Growth Rate
      Fig.49	Ada Digital Health Ltd Market Share
      Fig.50	Ariana Revenue and Growth Rate
      Fig.51	Ariana Market Share
      Fig.52	Babylon Healthcare Service Limited Revenue and Growth Rate
      Fig.53	Babylon Healthcare Service Limited Market Share
      Fig.54	Buoy Health Revenue and Growth Rate
      Fig.55	Buoy Health Market Share
      Fig.56	GYANT.com Inc Revenue and Growth Rate
      Fig.57	GYANT.com Inc Market Share
      Fig.58	Infermedica S.p.A Revenue and Growth Rate
      Fig.59	Infermedica S.p.A Market Share
      Fig.60	Microsoft Corporation Revenue and Growth Rate
      Fig.61	Microsoft Corporation Market Share
      Fig.62	PACT Care B.V Revenue and Growth Rate
      Fig.63	PACT Care B.V Market Share
      Fig.64	Sense.ly Inc Revenue and Growth Rate
      Fig.65	Sense.ly Inc Market Share
      Fig.66	Your.MD Revenue and Growth Rate
      Fig.67	Your.MD Market Share
      Fig.68	Woebot Revenue and Growth Rate
      Fig.69	Woebot Market Share
      Fig.70	HealthTap Inc Revenue and Growth Rate
      Fig.71	HealthTap Inc Market Share
      Fig.72	Baidu Inc Revenue and Growth Rate
      Fig.73	Baidu Inc Market Share
      Fig.74	COM Inc Revenue and Growth Rate
      Fig.75	COM Inc Market Share
      Fig.76	Market Dynamics
      Fig.77	Global Healthcare Chatbots – Value Chain Analysis
      Fig.78	Key Mandates and Regulations
      Fig.79	Technology Roadmap and Timeline
      Fig.80	Market Attractiveness Analysis – By Component
      Fig.81	Market Attractiveness Analysis – By Deployment Mode
      Fig.82	Market Attractiveness Analysis – By Application
      Fig.83	Market Attractiveness Analysis – By End User
      Fig.84	Market Attractiveness Analysis – By Region
      Fig.85	Healthcare Chatbots Industrial Chain Analysis
      Fig.86	Market Channels
      Fig.87	Marketing Channel Development Trend
      Fig.88	Growth in World Gross Product, 2008-2018
      

      List of Tables

      Table 1	Global Healthcare Chatbots Market, 2019 & 2026 (USD Million)
      Table 2	Global Healthcare Chatbots Market, by Component, 2016 – 2026 (USD Million)
      Table 3	Global Healthcare Chatbots Market, by Deployment Mode, 2016 – 2026 (USD Million)
      Table 4	Global Healthcare Chatbots Market, by Application, 2016 – 2026 (USD Million)
      Table 5	Global Healthcare Chatbots Market, by End User, 2016 – 2026 (USD Million)
      Table 6	Global Healthcare Chatbots Market, by Region, 2016 – 2026 (USD Million)
      Table 7	North America Healthcare Chatbots Market, by Country, 2016 – 2026 (USD Million)
      Table 8	North America Healthcare Chatbots Market, by Component, 2016 – 2026 (USD Million)
      Table 9	North America Healthcare Chatbots Market, by Deployment Mode, 2016 – 2026 (USD Million)
      Table 10 North America Healthcare Chatbots Market, by Application, 2016 – 2026 (USD Million)
      Table 11 North America Healthcare Chatbots Market, by End User, 2016 – 2026 (USD Million)
      Table 12 Europe Healthcare Chatbots Market, by Country, 2016 – 2026 (USD Million)
      Table 13 Europe Healthcare Chatbots Market, by Component, 2016 – 2026 (USD Million)
      Table 14 Europe Healthcare Chatbots Market, by Deployment Mode, 2016 – 2026 (USD Million)
      Table 15 Europe Healthcare Chatbots Market, by Application, 2016 – 2026 (USD Million)
      Table 16 Europe Healthcare Chatbots Market, by End User, 2016 – 2026 (USD Million)
      Table 17 Asia Pacific Healthcare Chatbots Market, by Country, 2016 – 2026 (USD Million)
      Table 18 Asia Pacific Healthcare Chatbots Market, by Component, 2016 – 2026 (USD Million)
      Table 19 Asia Pacific Healthcare Chatbots Market, by Deployment Mode, 2016 – 2026 (USD Million)
      Table 20 Asia Pacific Healthcare Chatbots Market, by Application, 2016 – 2026 (USD Million)
      Table 21 Asia Pacific Healthcare Chatbots Market, by End User, 2016 – 2026 (USD Million)
      Table 22 Latin America Healthcare Chatbots Market, by Country, 2016 – 2026 (USD Million)
      Table 23 Latin America Healthcare Chatbots Market, by Component, 2016 – 2026 (USD Million)
      Table 24 Latin America Healthcare Chatbots Market, by Deployment Mode, 2016 – 2026 (USD Million)
      Table 25 Latin America Healthcare Chatbots Market, by Application, 2016 – 2026 (USD Million)
      Table 26 Latin America Healthcare Chatbots Market, by End User, 2016 – 2026 (USD Million)
      Table 27 The Middle-East and Africa Healthcare Chatbots Market, by Country, 2016 – 2026 (USD Million)
      Table 28 The Middle-East and Africa Healthcare Chatbots Market, by Component, 2016 – 2026 (USD Million)
      Table 29 The Middle-East and Africa Healthcare Chatbots Market, by Deployment Mode, 2016 – 2026 (USD Million)
      Table 30 The Middle-East and Africa Healthcare Chatbots Market, by Application, 2016 – 2026 (USD Million)
      Table 31 The Middle-East and Africa Healthcare Chatbots Market, by End User, 2016 – 2026 (USD Million)
      Table 32 Global Healthcare Chatbots Market - Company Revenue Analysis, 2016 – 2019 (USD Million)
      Table 33 Global Healthcare Chatbots Market - Company Revenue Share Analysis, 2016 – 2019 (%)
      Table 34 Acquisitions and Mergers
      Table 35 Market Drivers – Impact Analysis
      Table 36 Market Restraints
      Table 37 Market Opportunities
      Table 38 Major Buyers of Healthcare Chatbots
      Table 39 Distributors/Traders of Healthcare Chatbots by Region
      

Industry Major Market Players

  • Ada Digital Health Ltd.
  • Ariana
  • Babylon Healthcare Service Limited
  • Buoy Health
  • GYANT.com Inc.
  • Infermedica S.p.A.
  • Microsoft Corporation
  • PACT Care B.V.
  • Sense.ly Inc.
  • Your.MD.
  • Woebot
  • HealthTap Inc.
  • Baidu Inc.
  • COM Inc.