Search Market Research Report

Discover Our Latest Reports
Discover Our Featured Reports
Discover Top Selling Reports

Condom Market Size, Share Global Analysis Report, , 2021 – 2026

report img

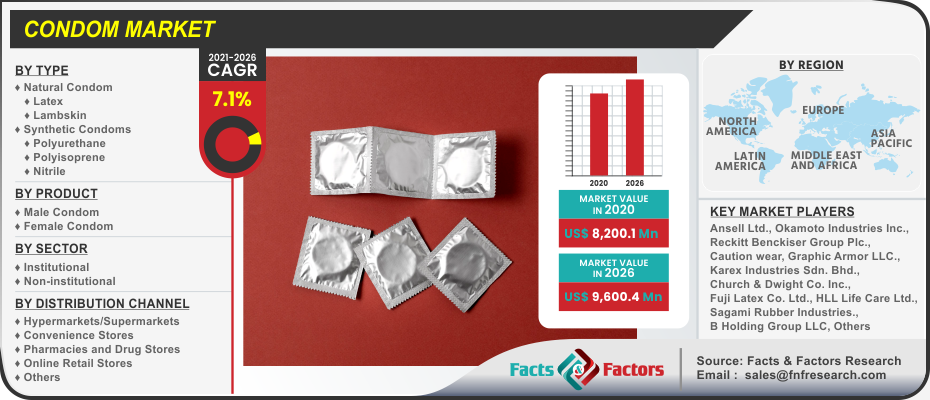
Condom Market By Type (Natural Condoms [Latex, Lambskin], and Synthetic Condoms [Polyurethane, Polyisoprene, Nitrile]), By Product (Male Condom and Female Condom), By Sector (Institutional and Non-institutional), and By Distribution Channel (Hypermarkets/Supermarkets, Convenience Stores, Pharmacies and Drug Stores, Online Retail Stores, and Others): Global Industry Perspective, Comprehensive Analysis, and Forecast, 2021 – 2026

Industry Insights

According to the report published by the Facts & Factors, global demand for the condom market was estimated at approximately USD 8,200.1 Million in 2020 and is expected to generate revenue of around USD 9,600.4 Million by the end of 2026, growing at a CAGR of around 7.1% between 2021 and 2026.

logoMarket Overview

Condoms are a sheath-shaped barrier tool used in sexual intercourse to decrease the probability of pregnancy or a sexually transmitted infection (STI). In addition, there are both male and female condoms. Their use to a great extent reduces the possibility of chlamydia, gonorrhea, trichomoniasis,  HIV/AIDS, and hepatitis B and to a small extent, it also protects against syphilis, human papillomavirus (HPV), and genital herpes.

Condom Market

To know more about this report | Request Free Sample Copy

logoIndustry Growth Factor

The increasing awareness about the use of condoms, the measures to reduce the spread of HIV and other STIs, and the accessibility of various types of condoms to go with consumer needs are major factors that are driving the global condom market growth. Moreover, the free distribution of condoms through government organizations is likely to propel market growth. The rising usage of condoms by young couples, sex workers, and the LGBTQ society is extensively reducing the public health concerns like HIV/AIDS, STDs, and population outbursts.

Furthermore, the proper and constant usage also facilitates avoiding the possibility of getting these conditions. In addition to that, the government in every country is undertaking initiatives to increase awareness and promote the usage of contraceptives in the young generation to control the outbreak of HIV and other STIs and also to avoid unplanned pregnancies. The free condom distribution by governments with the help of UNFPA and other organizations is projected to boost the usage of condoms in rural areas. Besides, the innovation in the condom market is showing the launch of a thin latex condom, exotic flavors, and several textures by numerous market players, propelling the market growth.

logoSegmentation Analysis

The global condom market is classified into type, product, sector, and distribution channel. Based on the type, the global condom market is segmented into natural condoms and synthetic condoms. The natural condoms are further sub-segmented into latex, lambskin. The synthetic condoms are sub-segmented into polyurethane, polyisoprene, nitrile.

On the basis of product, the global condom market is bifurcated into male condoms and female condoms. The global condom market based on the sector is divided into institutional and non-institutional. In terms of the distribution channel, the global condom market is separated into hypermarkets/supermarkets, convenience stores, pharmacies and drug stores, online retail stores, and others.

logoReport Scope

Report Attribute

Details

Market Size in 2020

USD 8,200.1 Million

Projected Market Size in 2026

USD 9,600.4 Million

CAGR Growth Rate

7.1% CAGR

Base Year

2020

Forecast Years

2021-2026

Key Market Players

Ansell Ltd., Reckitt Benckiser Group Plc., Okamoto Industries Inc., Caution wear, Graphic Armor LLC., Karex Industries Sdn. Bhd., Church & Dwight Co. Inc., Fuji Latex Co. Ltd., HLL Life Care Ltd., Sagami Rubber Industries., B Holding Group LLC, Mankind Pharma, Humanwell Group & CITIC Capital, Veru, Cupid Limited, and Mayer.

Key Segment

By Type, By Product, By Sector, By Distribution Channel, and By Region

Major Regions Covered

North America, Europe, Asia Pacific, Latin America, and the Middle East & Africa

Purchase Options

Request customized purchase options to meet your research needs. Explore purchase options

logo Regional Analysis

The region of Asia-Pacific is dominating the global condom market. China is one of the major markets in the condom industry. In the past years, the Chinese authorities have been likely to supply condoms either free of charge or at subsidized prices. Recently, the spreading out of the middle class is creating more opportunities for individuals to exercise personal freedom through purchasing superior condoms at high costs from retail stores. These factors are encouraging for popular condom brands like Okamoto, gaining brand recognition in the medium and high-price brackets. Other key factors propelling the regional market growth include the increasing demand in countries like India, Japan, and Australia due to the huge population, the rising prevalence of STDs and HIV, and the favorable government initiatives undertaken to control the population in the region.

The North American condom market is having the most of the revenue share in 2020 owing to the increase in the prevalence of HIV and the growing demand for female condoms in the United States. Moreover, the presence of key companies and the increased product launches in the region are set to influence regional market growth.

Furthermore, the Indian government in association with HLL Lifecare launched the Nirodh brand condoms intending, to offer dual protection from unwanted pregnancy as well as sexually transmitted infections (STI). This, in turn, is likely to fuel the growth of the condom market across the Asian region.

Also, Europe holds the second-largest market share, followed by North America. This is due to the rising demand by lesbians, sex workers, etc. The U.K., France, Germany, and Italy are the European countries with the highest market shares. The government initiatives being undertaken are promoting the use of contraceptives amongst the youth population to prevent the transmission of HIV in this region.

logo Competitive Players

Some prominent players driving in the global condom market include :

  • Ansell Ltd.
  • Reckitt Benckiser Group Plc.
  • Okamoto Industries Inc.
  • Caution wear
  • Graphic Armor LLC.
  • Karex Industries Sdn. Bhd.
  • Church & Dwight Co. Inc.
  • Fuji Latex Co. Ltd.
  • HLL Life Care Ltd.
  • Sagami Rubber Industries.
  • B Holding Group LLC
  • Mankind Pharma
  • Humanwell Group & CITIC Capital
  • Veru
  • Cupid Limited
  • Mayer

Moreover, these market players are implementing several growth strategies to prolong industry competition.

logo By Type Segment Analysis

  • Natural Condom
    • Latex
    • Lambskin
  • Synthetic Condoms
    • Polyurethane
    • Polyisoprene
    • Nitrile

logo By Product Segment Analysis

  • Male Condom
  • Female Condom

logo By Sector Segment Analysis

  • Institutional
  • Non-institutional

logo By Distribution Channel Segment Analysis

  • Hypermarkets/Supermarkets
  • Convenience Stores
  • Pharmacies and Drug Stores
  • Online Retail Stores
  • Others

logo Regional Segment Analysis

  • North America
    • U.S.
    • Canada
  • Europe
    • U.K.
    • France
    • Germany
    • Rest of Europe
  • Asia Pacific
    • China
    • Japan
    • India
    • South Korea
    • Rest of Asia Pacific
  • Latin America
    • Brazil
    • Rest of Latin America
  • The Middle East and Africa
    • GCC Countries
    • South Africa
    • Rest of Middle East Africa

Table of Content

  1. Chapter 1 Executive Summary
    1. 1.1. Introduction of Condom
    2. 1.2. Global Condom Market, 2019 & 2026 (USD Million)
    3. 1.3. Global Condom Market, 2016 – 2026(USD Million)
    4. 1.4. Global Condom MarketAbsolute Revenue Opportunity, 2016 – 2026(USD Million)
    5. 1.5. Global Condom MarketIncremental Revenue Opportunity, 2020 – 2026(USD Million)
  2. Chapter 2 Condom Market – Type Analysis
    1. 2.1. Global Condom Market – Type Overview
    2. 2.2. Global Condom Market Share, by Type, 2019 & 2026(USD Million)
    3. 2.3. Natural Condoms
      1. 2.3.1. Global Natural Condoms Condom Market, 2016 – 2026(USD Million)
    4. 2.4. Latex
      1. 2.4.1. Global Latex Condom Market, 2016 – 2026(USD Million)
    5. 2.5. Lambskin
      1. 2.5.1. Global Lambskin Condom Market, 2016 – 2026(USD Million)
    6. 2.6. Synthetic Condoms
      1. 2.6.1. Global Synthetic Condoms Condom Market, 2016 – 2026(USD Million)
    7. 2.7. Polyurethane
      1. 2.7.1. Global Polyurethane Condom Market, 2016 – 2026(USD Million)
    8. 2.8. Polyisoprene
      1. 2.8.1. Global Polyisoprene Condom Market, 2016 – 2026(USD Million)
    9. 2.9. Nitrile
      1. 2.9.1. Global Nitrile Condom Market, 2016 – 2026(USD Million)
  3. Chapter 3 Condom Market – Product Analysis
    1. 3.1. Global Condom Market – Product Overview
    2. 3.2. Global Condom Market Share, by Product, 2019 & 2026(USD Million)
    3. 3.3. Male Condom
      1. 3.3.1. Global Male Condom Condom Market, 2016 – 2026(USD Million)
    4. 3.4. Female Condom
      1. 3.4.1. Global Female Condom Condom Market, 2016 – 2026(USD Million)
  4. Chapter 4 Condom Market – Sector Analysis
    1. 4.1. Global Condom Market – Sector Overview
    2. 4.2. Global Condom Market Share, by Sector, 2019 & 2026(USD Million)
    3. 4.3. Institutional
      1. 4.3.1. Global Institutional Condom Market, 2016 – 2026(USD Million)
    4. 4.4. Non-institutional
      1. 4.4.1. Global Non-institutional Condom Market, 2016 – 2026(USD Million)
  5. Chapter 5 Condom Market – Distribution Channel Analysis
    1. 5.1. Global Condom Market – Distribution Channel Overview
    2. 5.2. Global Condom Market Share, by Distribution Channel, 2019 & 2026(USD Million)
    3. 5.3. Hypermarkets/Supermarkets
      1. 5.3.1. Global Hypermarkets/Supermarkets Condom Market, 2016 – 2026(USD Million)
    4. 5.4. Convenience Stores
      1. 5.4.1. Global Convenience Stores Condom Market, 2016 – 2026(USD Million)
    5. 5.5. Pharmacies and Drug Stores
      1. 5.5.1. Global Pharmacies and Drug Stores Condom Market, 2016 – 2026(USD Million)
    6. 5.6. Online Retail Stores
      1. 5.6.1. Global Online Retail Stores Condom Market, 2016 – 2026(USD Million)
    7. 5.7. Others
      1. 5.7.1. Global Others Condom Market, 2016 – 2026(USD Million)
  6. Chapter 6 Condom Market – Regional Analysis
    1. 6.1. Global Condom Market Regional Overview
    2. 6.2. Global Condom Market Share, by Region, 2019 & 2026(USD Million)
    3. 6.3. North America
      1. 6.3.1. North America Condom Market, 2016 – 2026(USD Million)
        1. 6.3.1.1. North America Condom Market, by Country, 2016 - 2026(USD Million)
      2. 6.3.2. North America Condom Market, by Type, 2016 – 2026
        1. 6.3.2.1. North America Condom Market, by Type, 2016 – 2026(USD Million)
      3. 6.3.3. North America Condom Market, by Product, 2016 – 2026
        1. 6.3.3.1. North America Condom Market, by Product, 2016 – 2026(USD Million)
      4. 6.3.4. North America Condom Market, by Sector, 2016 – 2026
        1. 6.3.4.1. North America Condom Market, by Sector, 2016 – 2026(USD Million)
      5. 6.3.5. North America Condom Market, by Distribution Channel, 2016 – 2026
        1. 6.3.5.1. North America Condom Market, by Distribution Channel, 2016 – 2026(USD Million)
      6. 6.3.6. U.S.
        1. 6.3.6.1. U.S. Condom Market, 2016 – 2026(USD Million)
      7. 6.3.7. Canada
        1. 6.3.7.1. Canada Condom Market, 2016 – 2026(USD Million)
    4. 6.4. Europe
      1. 6.4.1. Europe Condom Market, 2016 – 2026(USD Million)
        1. 6.4.1.1. Europe Condom Market, by Country, 2016 - 2026(USD Million)
      2. 6.4.2. Europe Condom Market, by Type, 2016 – 2026
        1. 6.4.2.1. Europe Condom Market, by Type, 2016 – 2026(USD Million)
      3. 6.4.3. Europe Condom Market, by Product, 2016 – 2026
        1. 6.4.3.1. Europe Condom Market, by Product, 2016 – 2026(USD Million)
      4. 6.4.4. Europe Condom Market, by Sector, 2016 – 2026
        1. 6.4.4.1. Europe Condom Market, by Sector, 2016 – 2026(USD Million)
      5. 6.4.5. Europe Condom Market, by Distribution Channel, 2016 – 2026
        1. 6.4.5.1. Europe Condom Market, by Distribution Channel, 2016 – 2026(USD Million)
      6. 6.4.6. Germany
        1. 6.4.6.1. Germany Condom Market, 2016 – 2026(USD Million)
      7. 6.4.7. France
        1. 6.4.7.1. France Condom Market, 2016 – 2026(USD Million)
      8. 6.4.8. U.K.
        1. 6.4.8.1. U.K. Condom Market, 2016 – 2026(USD Million)
      9. 6.4.9. Italy
        1. 6.4.9.1. Italy Condom Market, 2016 – 2026(USD Million)
      10. 6.4.10. Spain
        1. 6.4.10.1. Spain Condom Market, 2016 – 2026(USD Million)
      11. 6.4.11. Rest of Europe
        1. 6.4.11.1. Rest of Europe Condom Market, 2016 – 2026(USD Million)
    5. 6.5. Asia Pacific
      1. 6.5.1. Asia Pacific Condom Market, 2016 – 2026(USD Million)
        1. 6.5.1.1. Asia Pacific Condom Market, by Country, 2016 - 2026(USD Million)
      2. 6.5.2. Asia Pacific Condom Market, by Type, 2016 – 2026
        1. 6.5.2.1. Asia Pacific Condom Market, by Type, 2016 – 2026(USD Million)
      3. 6.5.3. Asia Pacific Condom Market, by Product, 2016 – 2026
        1. 6.5.3.1. Asia Pacific Condom Market, by Product, 2016 – 2026(USD Million)
      4. 6.5.4. Asia Pacific Condom Market, by Sector, 2016 – 2026
        1. 6.5.4.1. Asia Pacific Condom Market, by Sector, 2016 – 2026(USD Million)
      5. 6.5.5. Asia Pacific Condom Market, by Distribution Channel, 2016 – 2026
        1. 6.5.5.1. Asia Pacific Condom Market, by Distribution Channel, 2016 – 2026(USD Million)
      6. 6.5.6. China
        1. 6.5.6.1. China Condom Market, 2016 – 2026(USD Million)
      7. 6.5.7. Japan
        1. 6.5.7.1. Japan Condom Market, 2016 – 2026(USD Million)
      8. 6.5.8. India
        1. 6.5.8.1. India Condom Market, 2016 – 2026(USD Million)
      9. 6.5.9. South Korea
        1. 6.5.9.1. South Korea Condom Market, 2016 – 2026(USD Million)
      10. 6.5.10. South-East Asia
        1. 6.5.10.1. South-East Asia Condom Market, 2016 – 2026(USD Million)
      11. 6.5.11. Rest of Asia Pacific
        1. 6.5.11.1. Rest of Asia Pacific Condom Market, 2016 – 2026(USD Million)
    6. 6.6. Latin America
      1. 6.6.1. Latin America Condom Market, 2016 – 2026(USD Million)
        1. 6.6.1.1. Latin America Condom Market, by Country, 2016 - 2026(USD Million)
      2. 6.6.2. Latin America Condom Market, by Type, 2016 – 2026
        1. 6.6.2.1. Latin America Condom Market, by Type, 2016 – 2026(USD Million)
      3. 6.6.3. Latin America Condom Market, by Product, 2016 – 2026
        1. 6.6.3.1. Latin America Condom Market, by Product, 2016 – 2026(USD Million)
      4. 6.6.4. Latin America Condom Market, by Sector, 2016 – 2026
        1. 6.6.4.1. Latin America Condom Market, by Sector, 2016 – 2026(USD Million)
      5. 6.6.5. Latin America Condom Market, by Distribution Channel, 2016 – 2026
        1. 6.6.5.1. Latin America Condom Market, by Distribution Channel, 2016 – 2026(USD Million)
      6. 6.6.6. Brazil
        1. 6.6.6.1. Brazil Condom Market, 2016 – 2026(USD Million)
      7. 6.6.7. Mexico
        1. 6.6.7.1. Mexico Condom Market, 2016 – 2026(USD Million)
      8. 6.6.8. Rest of Latin America
        1. 6.6.8.1. Rest of Latin America Condom Market, 2016 – 2026(USD Million)
    7. 6.7. The Middle-East and Africa
      1. 6.7.1. The Middle-East and Africa Condom Market, 2016 – 2026(USD Million)
        1. 6.7.1.1. The Middle-East and Africa Condom Market, by Country, 2016 - 2026(USD Million)
      2. 6.7.2. The Middle-East and Africa Condom Market, by Type, 2016 – 2026
        1. 6.7.2.1. The Middle-East and Africa Condom Market, by Type, 2016 – 2026(USD Million)
      3. 6.7.3. The Middle-East and Africa Condom Market, by Product, 2016 – 2026
        1. 6.7.3.1. The Middle-East and Africa Condom Market, by Product, 2016 – 2026(USD Million)
      4. 6.7.4. The Middle-East and Africa Condom Market, by Sector, 2016 – 2026
        1. 6.7.4.1. The Middle-East and Africa Condom Market, by Sector, 2016 – 2026(USD Million)
      5. 6.7.5. The Middle-East and Africa Condom Market, by Distribution Channel, 2016 – 2026
        1. 6.7.5.1. The Middle-East and Africa Condom Market, by Distribution Channel, 2016 – 2026(USD Million)
      6. 6.7.6. GCC Countries
        1. 6.7.6.1. GCC Countries Condom Market, 2016 – 2026(USD Million)
      7. 6.7.7. South Africa
        1. 6.7.7.1. South Africa Condom Market, 2016 – 2026(USD Million)
      8. 6.7.8. Rest of Middle-East Africa
        1. 6.7.8.1. Rest of Middle-East Africa Condom Market, 2016 – 2026(USD Million)
  7. Chapter 7 Condom Market – Competitive Landscape
    1. 7.1. Competitor Market Share – Revenue
    2. 7.2. Market Concentration Rate Analysis, Top 3 and Top 5 Players
    3. 7.3. Strategic Developments
      1. 7.3.1. Acquisitions and Mergers
      2. 7.3.2. New Products
      3. 7.3.3. Research & Development Activities
  8. Chapter 8 Company Profiles
    1. 8.1. Ansell Ltd.
      1. 8.1.1. Company Overview
      2. 8.1.2. Product/ServicePortfolio
      3. 8.1.3. Ansell Ltd. Sales, Revenue, and Gross Margin
      4. 8.1.4. Ansell Ltd. Revenue and Growth Rate
      5. 8.1.5. Ansell Ltd. Market Share
      6. 8.1.6. Recent Initiatives, Funding/VC Activities, and Technological Innovations
    2. 8.2. Reckitt Benckiser Group Plc.
      1. 8.2.1. Company Overview
      2. 8.2.2. Product/ServicePortfolio
      3. 8.2.3. Reckitt Benckiser Group Plc. Sales, Revenue, and Gross Margin
      4. 8.2.4. Reckitt Benckiser Group Plc. Revenue and Growth Rate
      5. 8.2.5. Reckitt Benckiser Group Plc. Market Share
      6. 8.2.6. Recent Initiatives, Funding/VC Activities, and Technological Innovations
    3. 8.3. Okamoto Industries Inc.
      1. 8.3.1. Company Overview
      2. 8.3.2. Product/ServicePortfolio
      3. 8.3.3. Okamoto Industries Inc. Sales, Revenue, and Gross Margin
      4. 8.3.4. Okamoto Industries Inc. Revenue and Growth Rate
      5. 8.3.5. Okamoto Industries Inc. Market Share
      6. 8.3.6. Recent Initiatives, Funding/VC Activities, and Technological Innovations
    4. 8.4. Caution wear
      1. 8.4.1. Company Overview
      2. 8.4.2. Product/ServicePortfolio
      3. 8.4.3. Caution wear Sales, Revenue, and Gross Margin
      4. 8.4.4. Caution wear Revenue and Growth Rate
      5. 8.4.5. Caution wear Market Share
      6. 8.4.6. Recent Initiatives, Funding/VC Activities, and Technological Innovations
    5. 8.5. Graphic Armor LLC.
      1. 8.5.1. Company Overview
      2. 8.5.2. Product/ServicePortfolio
      3. 8.5.3. Graphic Armor LLC. Sales, Revenue, and Gross Margin
      4. 8.5.4. Graphic Armor LLC. Revenue and Growth Rate
      5. 8.5.5. Graphic Armor LLC. Market Share
      6. 8.5.6. Recent Initiatives, Funding/VC Activities, and Technological Innovations
    6. 8.6. Karex Industries Sdn. Bhd.
      1. 8.6.1. Company Overview
      2. 8.6.2. Product/ServicePortfolio
      3. 8.6.3. Karex Industries Sdn. Bhd. Sales, Revenue, and Gross Margin
      4. 8.6.4. Karex Industries Sdn. Bhd. Revenue and Growth Rate
      5. 8.6.5. Karex Industries Sdn. Bhd. Market Share
      6. 8.6.6. Recent Initiatives, Funding/VC Activities, and Technological Innovations
    7. 8.7. Church & Dwight Co. Inc.
      1. 8.7.1. Company Overview
      2. 8.7.2. Product/ServicePortfolio
      3. 8.7.3. Church & Dwight Co. Inc. Sales, Revenue, and Gross Margin
      4. 8.7.4. Church & Dwight Co. Inc. Revenue and Growth Rate
      5. 8.7.5. Church & Dwight Co. Inc. Market Share
      6. 8.7.6. Recent Initiatives, Funding/VC Activities, and Technological Innovations
    8. 8.8. Fuji Latex Co. Ltd.
      1. 8.8.1. Company Overview
      2. 8.8.2. Product/ServicePortfolio
      3. 8.8.3. Fuji Latex Co. Ltd. Sales, Revenue, and Gross Margin
      4. 8.8.4. Fuji Latex Co. Ltd. Revenue and Growth Rate
      5. 8.8.5. Fuji Latex Co. Ltd. Market Share
      6. 8.8.6. Recent Initiatives, Funding/VC Activities, and Technological Innovations
    9. 8.9. HLL Life Care Ltd.
      1. 8.9.1. Company Overview
      2. 8.9.2. Product/ServicePortfolio
      3. 8.9.3. HLL Life Care Ltd. Sales, Revenue, and Gross Margin
      4. 8.9.4. HLL Life Care Ltd. Revenue and Growth Rate
      5. 8.9.5. HLL Life Care Ltd. Market Share
      6. 8.9.6. Recent Initiatives, Funding/VC Activities, and Technological Innovations
    10. 8.10. Sagami Rubber Industries.
      1. 8.10.1. Company Overview
      2. 8.10.2. Product/ServicePortfolio
      3. 8.10.3. Sagami Rubber Industries. Sales, Revenue, and Gross Margin
      4. 8.10.4. Sagami Rubber Industries. Revenue and Growth Rate
      5. 8.10.5. Sagami Rubber Industries. Market Share
      6. 8.10.6. Recent Initiatives, Funding/VC Activities, and Technological Innovations
    11. 8.11. B Holding Group LLC
      1. 8.11.1. Company Overview
      2. 8.11.2. Product/ServicePortfolio
      3. 8.11.3. B Holding Group LLC Sales, Revenue, and Gross Margin
      4. 8.11.4. B Holding Group LLC Revenue and Growth Rate
      5. 8.11.5. B Holding Group LLC Market Share
      6. 8.11.6. Recent Initiatives, Funding/VC Activities, and Technological Innovations
    12. 8.12. Mankind Pharma
      1. 8.12.1. Company Overview
      2. 8.12.2. Product/ServicePortfolio
      3. 8.12.3. Mankind Pharma Sales, Revenue, and Gross Margin
      4. 8.12.4. Mankind Pharma Revenue and Growth Rate
      5. 8.12.5. Mankind Pharma Market Share
      6. 8.12.6. Recent Initiatives, Funding/VC Activities, and Technological Innovations
    13. 8.13. Humanwell Group & CITIC Capital
      1. 8.13.1. Company Overview
      2. 8.13.2. Product/ServicePortfolio
      3. 8.13.3. Humanwell Group & CITIC Capital Sales, Revenue, and Gross Margin
      4. 8.13.4. Humanwell Group & CITIC Capital Revenue and Growth Rate
      5. 8.13.5. Humanwell Group & CITIC Capital Market Share
      6. 8.13.6. Recent Initiatives, Funding/VC Activities, and Technological Innovations
    14. 8.14. Veru
      1. 8.14.1. Company Overview
      2. 8.14.2. Product/ServicePortfolio
      3. 8.14.3. Veru Sales, Revenue, and Gross Margin
      4. 8.14.4. Veru Revenue and Growth Rate
      5. 8.14.5. Veru Market Share
      6. 8.14.6. Recent Initiatives, Funding/VC Activities, and Technological Innovations
    15. 8.15. Cupid Limited
      1. 8.15.1. Company Overview
      2. 8.15.2. Product/ServicePortfolio
      3. 8.15.3. Cupid Limited Sales, Revenue, and Gross Margin
      4. 8.15.4. Cupid Limited Revenue and Growth Rate
      5. 8.15.5. Cupid Limited Market Share
      6. 8.15.6. Recent Initiatives, Funding/VC Activities, and Technological Innovations
    16. 8.16. Mayer
      1. 8.16.1. Company Overview
      2. 8.16.2. Product/ServicePortfolio
      3. 8.16.3. Mayer Sales, Revenue, and Gross Margin
      4. 8.16.4. Mayer Revenue and Growth Rate
      5. 8.16.5. Mayer Market Share
      6. 8.16.6. Recent Initiatives, Funding/VC Activities, and Technological Innovations
  9. Chapter 9 Condom — Industry Analysis
    1. 9.1. Introduction and Taxonomy
    2. 9.2. Condom Market – Key Trends
      1. 9.2.1. Market Drivers
      2. 9.2.2. Market Restraints
      3. 9.2.3. Market Opportunities
    3. 9.3. Value Chain Analysis
    4. 9.4. Key Mandates and Regulations
    5. 9.5. Technology Roadmap and Timeline
    6. 9.6. Condom Market – Attractiveness Analysis
      1. 9.6.1. By Type
      2. 9.6.2. By Product
      3. 9.6.3. By Sector
      4. 9.6.4. By Distribution Channel
      5. 9.6.5. By Region
  10. Chapter 10 Industrial Chain, Sourcing Strategy, and Downstream Buyers
    1. 10.1. Condom Industrial Chain Analysis
    2. 10.2. Downstream Buyers
    3. 10.3. Distributors/Traders List
  11. Chapter 11 Marketing Strategy Analysis
    1. 11.1. Marketing Channel
    2. 11.2. Direct Marketing
    3. 11.3. Indirect Marketing
    4. 11.4. Marketing Channel Development Trends
    5. 11.5. Economic/Political Environmental Change
  12. Chapter 12 Report Conclusion& Key Insights
    1. 12.1. Key Insights from Primary Interviews & Surveys Respondents
    2. 12.2. Key Takeaways from Analysts, Consultants, and Industry Leaders
  13. Chapter 13 Research Approach & Methodology
    1. 13.1. Report Description
    2. 13.2. Research Scope
    3. 13.3. Research Methodology
      1. 13.3.1. Secondary Research
      2. 13.3.2. Primary Research
      3. 13.3.3. Statistical Models
        1. 13.3.3.1. Company Share Analysis Model
        2. 13.3.3.2. Revenue Based Modeling
      4. 13.3.4. Research Limitations

      List of Figures

      Fig.1	Product Picture of  Condom
      Fig.2	Global  Condom  Market, 2016 – 2026(USD Million)
      Fig.3	Global  Condom  MarketAbsolute Revenue Opportunity, 2016 – 2026(USD Million)
      Fig.4	Global  Condom  MarketIncremental Revenue Opportunity, 2020 – 2026(USD Million)
      Fig.5	Global  Condom  Market Share, by Type, 2019 & 2026(USD Million)
      Fig.6	Global Natural Condoms Condom  Market, 2016 – 2026(USD Million)
      Fig.7	Global Latex Condom  Market, 2016 – 2026(USD Million)
      Fig.8	Global Lambskin Condom  Market, 2016 – 2026(USD Million)
      Fig.9	Global Synthetic Condoms Condom  Market, 2016 – 2026(USD Million)
      Fig.10	Global Polyurethane Condom  Market, 2016 – 2026(USD Million)
      Fig.11	Global Polyisoprene Condom  Market, 2016 – 2026(USD Million)
      Fig.12	Global Nitrile Condom  Market, 2016 – 2026(USD Million)
      Fig.13	Global  Condom  Market Share, by Product, 2019 & 2026(USD Million)
      Fig.14	Global Male Condom Condom  Market, 2016 – 2026(USD Million)
      Fig.15	Global Female Condom Condom  Market, 2016 – 2026(USD Million)
      Fig.16	Global  Condom  Market Share, by Sector, 2019 & 2026(USD Million)
      Fig.17	Global Institutional Condom  Market, 2016 – 2026(USD Million)
      Fig.18	Global Non-institutional Condom  Market, 2016 – 2026(USD Million)
      Fig.19	Global  Condom  Market Share, by Distribution Channel, 2019 & 2026(USD Million)
      Fig.20	Global Hypermarkets/Supermarkets Condom  Market, 2016 – 2026(USD Million)
      Fig.21	Global Convenience Stores Condom  Market, 2016 – 2026(USD Million)
      Fig.22	Global Pharmacies and Drug Stores Condom  Market, 2016 – 2026(USD Million)
      Fig.23	Global Online Retail Stores Condom  Market, 2016 – 2026(USD Million)
      Fig.24	Global Others Condom  Market, 2016 – 2026(USD Million)
      Fig.25	Global  Condom  MarketShare, by Region, 2019 & 2026(USD Million)
      Fig.26	North America Condom  Market, 2016 – 2026(USD Million)
      Fig.27	U.S. Condom  Market, 2016 – 2026(USD Million)
      Fig.28	Canada Condom  Market, 2016 – 2026(USD Million)
      Fig.29	Europe Condom  Market, 2016 – 2026(USD Million)
      Fig.30	Germany Condom  Market, 2016 – 2026(USD Million)
      Fig.31	France Condom  Market, 2016 – 2026(USD Million)
      Fig.32	U.K. Condom  Market, 2016 – 2026(USD Million)
      Fig.33	Italy Condom  Market, 2016 – 2026(USD Million)
      Fig.34	Spain Condom  Market, 2016 – 2026(USD Million)
      Fig.35	Rest of Europe Condom  Market, 2016 – 2026(USD Million)
      Fig.36	Asia Pacific Condom  Market, 2016 – 2026(USD Million)
      Fig.37	China Condom  Market, 2016 – 2026(USD Million)
      Fig.38	Japan Condom  Market, 2016 – 2026(USD Million)
      Fig.39	India Condom  Market, 2016 – 2026(USD Million)
      Fig.40	South  Korea Condom  Market, 2016 – 2026(USD Million)
      Fig.41	South-East Asia Condom  Market, 2016 – 2026(USD Million)
      Fig.42	Rest of Asia Pacific Condom  Market, 2016 – 2026(USD Million)
      Fig.43	Latin America Condom  Market, 2016 – 2026(USD Million)
      Fig.44	Brazil Condom  Market, 2016 – 2026(USD Million)
      Fig.45	Mexico Condom  Market, 2016 – 2026(USD Million)
      Fig.46	Rest of Latin America Condom  Market, 2016 – 2026(USD Million)
      Fig.47	The Middle-East and Africa Condom  Market, 2016 – 2026(USD Million)
      Fig.48	GCC Countries Condom  Market, 2016 – 2026(USD Million)
      Fig.49	South Africa Condom  Market, 2016 – 2026(USD Million)
      Fig.50	Rest of Middle-East Africa Condom  Market, 2016 – 2026(USD Million)
      Fig.51	Competitor Market Share – Revenue
      Fig.52	Ansell Ltd. Revenue and Growth Rate
      Fig.53	Ansell Ltd. Market Share
      Fig.54	Reckitt Benckiser Group Plc. Revenue and Growth Rate
      Fig.55	Reckitt Benckiser Group Plc. Market Share
      Fig.56	Okamoto Industries Inc. Revenue and Growth Rate
      Fig.57	Okamoto Industries Inc. Market Share
      Fig.58	Caution wear Revenue and Growth Rate
      Fig.59	Caution wear Market Share
      Fig.60	Graphic Armor LLC. Revenue and Growth Rate
      Fig.61	Graphic Armor LLC. Market Share
      Fig.62	Karex Industries Sdn. Bhd. Revenue and Growth Rate
      Fig.63	Karex Industries Sdn. Bhd. Market Share
      Fig.64	Church & Dwight Co. Inc. Revenue and Growth Rate
      Fig.65	Church & Dwight Co. Inc. Market Share
      Fig.66	Fuji Latex Co. Ltd. Revenue and Growth Rate
      Fig.67	Fuji Latex Co. Ltd. Market Share
      Fig.68	HLL Life Care Ltd. Revenue and Growth Rate
      Fig.69	HLL Life Care Ltd. Market Share
      Fig.70	Sagami Rubber Industries. Revenue and Growth Rate
      Fig.71	Sagami Rubber Industries. Market Share
      Fig.72	B Holding Group LLC Revenue and Growth Rate
      Fig.73	B Holding Group LLC Market Share
      Fig.74	Mankind Pharma Revenue and Growth Rate
      Fig.75	Mankind Pharma Market Share
      Fig.76	Humanwell Group & CITIC Capital Revenue and Growth Rate
      Fig.77	Humanwell Group & CITIC Capital Market Share
      Fig.78	Veru Revenue and Growth Rate
      Fig.79	Veru Market Share
      Fig.80	Cupid Limited Revenue and Growth Rate
      Fig.81	Cupid Limited Market Share
      Fig.82	Mayer Revenue and Growth Rate
      Fig.83	Mayer Market Share
      Fig.84	Market Dynamics
      Fig.85	Global  Condom  – Value Chain Analysis
      Fig.86	Key Mandates and Regulations
      Fig.87	Technology Roadmap and Timeline
      Fig.88	Market Attractiveness Analysis – By Type
      Fig.89	Market Attractiveness Analysis – By Product
      Fig.90	Market Attractiveness Analysis – By Sector
      Fig.91	Market Attractiveness Analysis – By Distribution Channel
      Fig.92	Market Attractiveness Analysis – By Region
      Fig.93	Condom  Industrial Chain Analysis
      Fig.94	Market Channels
      Fig.95	Marketing Channel Development Trend
      Fig.96	Growth in World Gross Product, 2008-2018
      

      List of Tables

      Table 1	Global  Condom Market, 2019 & 2026(USD Million)
      Table 2	Global  Condom Market, by Type, 2016 – 2026(USD Million)
      Table 3	Global  Condom Market, by Product, 2016 – 2026(USD Million)
      Table 4	Global  Condom Market, by Sector, 2016 – 2026(USD Million)
      Table 5	Global  Condom Market, by Distribution Channel, 2016 – 2026(USD Million)
      Table 6	Global  Condom Market, by Region, 2016 – 2026(USD Million)
      Table 7	North America Condom  Market, by Country, 2016 – 2026(USD Million)
      Table 8	North America Condom  Market, by Type, 2016 – 2026(USD Million)
      Table 9	North America Condom  Market, by Product, 2016 – 2026(USD Million)
      Table 10 North America Condom  Market, by Sector, 2016 – 2026(USD Million)
      Table 11 North America Condom  Market, by Distribution Channel, 2016 – 2026(USD Million)
      Table 12 Europe Condom  Market, by Country, 2016 – 2026(USD Million)
      Table 13 Europe Condom  Market, by Type, 2016 – 2026(USD Million)
      Table 14 Europe Condom  Market, by Product, 2016 – 2026(USD Million)
      Table 15 Europe Condom  Market, by Sector, 2016 – 2026(USD Million)
      Table 16 Europe Condom  Market, by Distribution Channel, 2016 – 2026(USD Million)
      Table 17 Asia Pacific Condom  Market, by Country, 2016 – 2026(USD Million)
      Table 18 Asia Pacific Condom  Market, by Type, 2016 – 2026(USD Million)
      Table 19 Asia Pacific Condom  Market, by Product, 2016 – 2026(USD Million)
      Table 20 Asia Pacific Condom  Market, by Sector, 2016 – 2026(USD Million)
      Table 21 Asia Pacific Condom  Market, by Distribution Channel, 2016 – 2026(USD Million)
      Table 22 Latin America Condom  Market, by Country, 2016 – 2026(USD Million)
      Table 23 Latin America Condom  Market, by Type, 2016 – 2026(USD Million)
      Table 24 Latin America Condom  Market, by Product, 2016 – 2026(USD Million)
      Table 25 Latin America Condom  Market, by Sector, 2016 – 2026(USD Million)
      Table 26 Latin America Condom  Market, by Distribution Channel, 2016 – 2026(USD Million)
      Table 27 The Middle-East and Africa Condom  Market, by Country, 2016 – 2026(USD Million)
      Table 28 The Middle-East and Africa Condom  Market, by Type, 2016 – 2026(USD Million)
      Table 29 The Middle-East and Africa Condom  Market, by Product, 2016 – 2026(USD Million)
      Table 30 The Middle-East and Africa Condom  Market, by Sector, 2016 – 2026(USD Million)
      Table 31 The Middle-East and Africa Condom  Market, by Distribution Channel, 2016 – 2026(USD Million)
      Table 32 Global  Condom  Market - Company Revenue Analysis, 2016 – 2019(USD Million)
      Table 33 Global  Condom  Market - Company Revenue Share Analysis, 2016 – 2019(%)
      Table 34 Acquisitions and Mergers
      Table 35 Market Drivers – Impact Analysis
      Table 36 Market Restraints
      Table 37 Market Opportunities
      Table 38 Major Buyers of  Condom
      Table 39 Distributors/Traders of  Condom  by Region
      

Industry Major Market Players

  • Ansell Ltd.
  • Reckitt Benckiser Group Plc.
  • Okamoto Industries Inc.
  • Caution wear
  • Graphic Armor LLC.
  • Karex Industries Sdn. Bhd.
  • Church & Dwight Co. Inc.
  • Fuji Latex Co. Ltd.
  • HLL Life Care Ltd.
  • Sagami Rubber Industries.
  • B Holding Group LLC
  • Mankind Pharma
  • Humanwell Group & CITIC Capital
  • Veru
  • Cupid Limited
  • Mayer