Search Market Research Report

Discover Our Latest Reports
Discover Our Featured Reports
Discover Top Selling Reports

Digital Pathology Market Size, Growth, Global Trends, Forecast 2022-2028

report img

Digital Pathology Market by Product (Scanners, Software, Communication Systems, and Storage Systems), By Type (Human Pathology, Veterinary Pathology), By Application (Drug Discovery, Disease Diagnosis, Training & Education, and Tele-consultation), By End User (Hospitals, Pharmaceutical & Biotechnology Companies, Diagnostic Labs, and Academic & Research Institutes): Global Industry Perspective, Comprehensive Analysis, and Forecast 2022 – 2028

Industry Insights

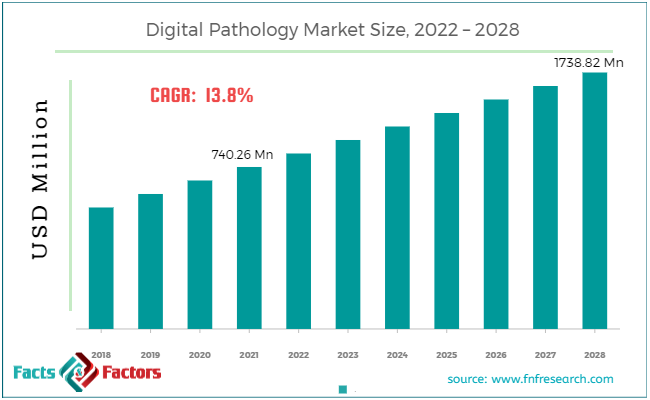
[215+ Pages Report] According to the report published by Facts and Factors, the global Digital Pathology market was valued at approximately USD 740.26 million in 2021, and is expected to generate revenue of around USD 1738.82 million by end of 2028, growing at a CAGR of around 13.8% between 2022 and 2028. The rising number of pathologists, the benefits of digital pathology, and its rapid adoption in the healthcare industry are expected to boost market demand over the forecast period.

Digital Pathology Market Size

To know more about this report | Request Free Sample Copy

logoMarket Overview       

Digital pathology is a diagnosis carried out by the use of various computer technologies. Digitized specimen slide generates information that is managed by advanced computation and through virtual microscopy. Advancement in genetic science, medical science as well as computer technology together hand in hand has developed the subfield of pathology called digital pathology. During disease diagnosis, digitization of pathology is performed at hospitals, diagnostic centers. It offers a high-resolution sample scanning, analysis of computer images, and online storage of digital slides which enables pathologists to examine slides without forensic evidence

logoCOVID-19 Impact:

The COVID-19 pandemic is expected to have a beneficial impact on the worldwide digital pathology industry. The FDA's Center for Devices and Radiological Health issued an enforcement policy for remote digital pathology devices aimed at pathologists, clinical laboratories, and drug administration personnel. As a result of the growth in chronic disease cases, the use of digital pathology systems for diagnosis has risen, which is expected to boost the digital pathology market over the forecast period (2022-2028).

As a result, new developments by leading competitors and an increased number of product approvals drive market growth. However, the high cost of digital pathology equipment is projected to stymie market expansion during the projected timeframe.

Global Digital Pathology Market

To know more about this report | Request Free Sample Copy

logoIndustry Growth Factors

One of the important driving factors for the digital pathology market is an enhancement in lab efficiency. An improvement in lab efficiency is critical for the correct and swift diagnosis of the disease and improved access to medical reports via apps and websites. Moreover, increasing penetration of medical insurance in the population is driving the demand for pathological services, and to provide swift and efficient services, investments in digital pathology infrastructure have increased significantly. The rising prevalence of chronic diseases has further increased the requirement for digital pathology. As per the WHO survey, the total number of chronic respiratory disease cases increased by 39.5% between 1990 to 2017. At COVID-19, a Digital Pathology Enforcement Policy for Pathologists, clinical laboratories, healthcare centers, and drug management staff was issued by the US FDA's Centre for Devices and Radiological Health.

logoDrivers

  • Growing digital pathology usage for lab performance

Digital pathology improves lab efficiency by lowering costs, speeding up response times, and giving subject-matter expertise. Patients and doctors rely on lab data for diagnosis, thus tests must be conducted fast and precisely. Moreover, pathologists save money and time by accessing digitized slides via web services. The COVID-19 pandemic has prompted lockdowns and social restrictions. These constraints have spurred demand for digital pathology technologies, which allow pathologists to assess medical outcomes distant from initial diagnosis.

logoRestraints

  • Digitized pathology systems are extremely expensive

A standard digital pathology system contains a slide scanner, image server, and software. A digital pathology scanner costs between $110,000 and $130,000 in Asia-Pacific. Big hospitals with huge capital expenditures can afford these technologies, whereas pathologists and academic institutes with small budgets or no IT assistance cannot. Healthcare professionals in poor countries like India, Brazil, and Mexico cannot afford such high-tech equipment. Also, trained personnel are necessary to efficiently handle and maintain digital pathology systems. It is believed that the expensive cost of these systems, coupled with a lack of experienced individuals to handle digital pathology equipment, will limit their use.

logoOpportunities

  • Private pathology practices to get affordable scanners

The high cost of digital pathology technology, like scanners, restricts industry expansion. Thus, the introduction of cheap scanners should benefit participants in the digital pathology industry. Small firms can't afford pricey digital pathology systems. The availability of low-cost scanners and small players' willingness to digitize pathology processes may inspire pathologists with restricted finances to use them.

logoChallenges

  • Lack of skilled pathologists

Pathologists perform vital laboratory tests for illness diagnosis. However, there is a lack of pathologists globally, particularly in Africa and Asia-Pacific. A Springer study (2020) found that Switzerland had 35,355 residents per pathologist, while Canada and the US have 20,658 and 25,325, respectively. In Germany, one pathologist per 47,989 people. Digital pathology helps clinicians safely share data with pathologists across geographical borders. Moreover, modern technologies like AI and machine learning assist pathologists to diagnose diseases faster and more effectively. Due to the acute lack of pathologists, digital pathology is likely to be increasingly used for remote pathological consultation and services.

logoSegmentation Analysis

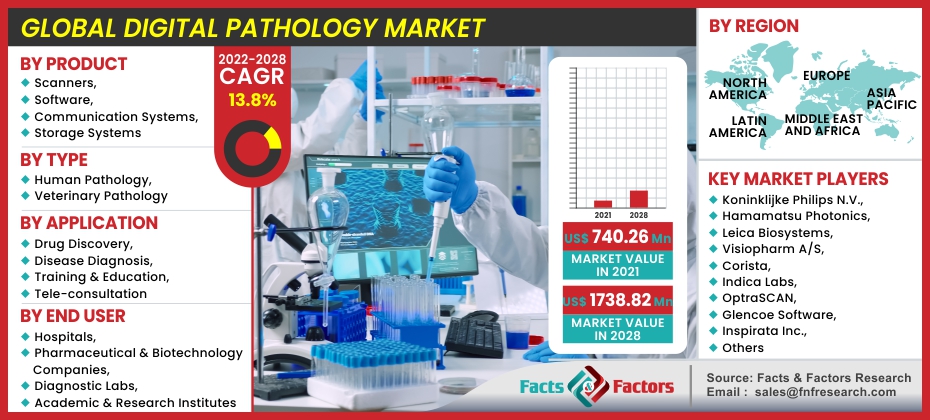
The global digital pathology market is segmented on the basis of product, type, application, and end-user. On the basis of Product, the global digital pathology market is segmented into scanners, software, communication systems, and storage systems. In 2020, the scanners segment was expected to account for the majority of the market share. The software segment, on the other hand, is predicted to grow at the fastest rate between 2021 and 2028. The scanner aids in the production of rapid, dependable, and high-resolution photographs of cell nuclei. It also assists pathologists, histologists, and other medical experts in scanning slides and uploading them to a network for remote access and collaboration between experts.

On the basis of type, the global market is categorized into human pathology, veterinary pathology. By application segment, the global digital pathology market is divided into drug discovery, disease diagnosis, training & education, and teleconsultation. In 2020, the drug discovery category was expected to account for the biggest percentage of the market overall. During the year 2021–2028, the same segment, on the other hand, is predicted to post the greatest CAGR. One of the primary drivers of growth in the drug discovery segment is the core advantage that digital pathology offers pharmaceutical research, which is the application of image analysis algorithms for decreasing the number of subject interpretations, growing awareness of neurological disorders, and the availability of advanced EEG products.

By end-user, the market is classified into hospitals, pharmaceutical & biotechnology companies, diagnostic labs, and academic & research institutes. Pharmaceutical and biotechnology companies are expected to dominate the industry in 2020. By 2028, the same category is predicted to be the market's largest shareholder. Pharmaceutical and biotechnology companies are digitizing their work. Companies are continually searching for new chemicals and biomarkers. In addition, digital pathology facilitates data interchange between pharmaceutical corporations and R&D labs. Due to the causes listed above, the market for pharma and biotech firms is expected to rise in the future years.

logoReport Scope

Report Attribute

Details

Market Size in 2021

USD 740.26 Million

Projected Market Size in 2028

USD 1738.82 Million

CAGR Growth Rate

13.8% CAGR

Base Year

2021

Forecast Years

2022-2028

Key Market Players

Koninklijke Philips N.V., Hamamatsu Photonics, Leica Biosystems, Visiopharm A/S, Corista, Indica Labs, OptraSCAN, Glencoe Software, Inspirata Inc., Mikroscan Technologies, Proscia Inc., Kanteron Systems, Roche, Apollo Enterprise Imaging, Sectra AB, and Huron Digital Pathology among others.

Key Segment

By Product, By Type, By Application, By End User, and By Region

Major Regions Covered

North America, Europe, Asia Pacific, Latin America, and the Middle East & Africa

Purchase Options

Request customized purchase options to meet your research needs. Explore purchase options

logo Regional Landscape

Asia-Pacific is expected to record the highest rate of growth over the next few years due to a rise in awareness of digital pathology systems. The presence of a large patient base with chronic & infectious diseases and an increase in expenditure in healthcare infrastructure will support the market growth during the forecast timeline. Moreover, the ever-changing life science sector is predicted to offer lucrative market expansion opportunities in developing economies such as China, India, and Malaysia. North America accounted for the major market share among the others, and it has been expected to maintain this trend in the near future, owing to the huge adoption of digital pathology systems.

logoRecent Developments

  • September 2021: In a joint venture, Visiopharm (Denmark) and Agilent Technologies, Inc. (US) will commercialize Visiopharm's CE-IVD-certified AI-driven Precision Pathology software alongside Agilent's automated pathology staining solutions.
  • August 2021: In a signed agreement, Sectra AB (Sweden) and the University Medical Center Utrecht (Netherlands) agreed that UMC will use Sectra's pathology module to facilitate productive interdisciplinary conversations between pathologists and radiologists at the hospital.
  • April 2021: For nations throughout North America and Europe, Leica Biosystems and Paige.AI, Inc. (US) have teamed up to bring Paige's artificial intelligence-powered research tools for tumor detection, grading, and quantification to the Leica Biosystems digital pathology platform.

logo Competitive Landscape

A large selection of diagnostic products is available from manufacturers, who are concentrating on product development. Furthermore, leading players in the digital pathology market are concentrating on expanding their global and regional footprint through acquisitions and international expansion on an international scale.

Major players in the market are :

  • Koninklijke Philips N.V.
  • Hamamatsu Photonics
  • Leica Biosystems
  • Visiopharm A/S
  • Corista
  • Indica Labs
  • OptraSCAN
  • Glencoe Software
  • Inspirata Inc.
  • Mikroscan Technologies
  • Proscia Inc.
  • Kanteron Systems
  • Roche
  • Apollo Enterprise Imaging
  • Sectra AB
  • Huron Digital Pathology

The Global Digital Pathology Market is segmented as follows:

logoBy Product Segment Analysis

  • Scanners
  • Software
  • Communication Systems
  • Storage Systems

logoBy Type Segment Analysis

  • Human Pathology
  • Veterinary Pathology

logoBy Application Segment Analysis

  • Drug Discovery
  • Disease Diagnosis
  • Training & Education
  • Tele-consultation

logoBy End-User Segment Analysis

  • Hospitals
  • Pharmaceutical & Biotechnology Companies
  • Diagnostic Labs
  • Academic & Research Institutes

logo Regional Segment Analysis

  • North America
    • U.S.
    • Canada
  • Europe
    • UK
    • France
    • Germany
    • Italy
    • Spain
    • Rest of Europe
  • Asia Pacific
    • China
    • Japan
    • India
    • South Korea
    • Southeast Asia
    • Rest of Asia Pacific
  • Latin America
    • Brazil
    • Mexico
    • Rest of Latin America
  • The Middle East and Africa
    • GCC Countries
    • South Africa
    • Rest of MEA

Table of Content

  1. Chapter 1 Executive Summary
    1. 1.1. Introduction of Digital Pathology
    2. 1.2. Global Digital Pathology Market, 2022 & 2028 (USD Million)
    3. 1.3. Global Digital Pathology Market, 2017 – 2028 (USD Million)
    4. 1.4. Global Digital Pathology Market Absolute Revenue Opportunity, 2017 – 2028 (USD Million)
    5. 1.5. Global Digital Pathology Market Incremental Revenue Opportunity, 2021 – 2028 (USD Million)
  2. Chapter 2 Digital Pathology Market – Product Analysis
    1. 2.1. Global Digital Pathology Market – Product Overview
    2. 2.2. Global Digital Pathology Market Share, by Product, 2022 & 2028 (USD Million)
    3. 2.3. Scanners
      1. 2.3.1. Global Scanners Digital Pathology Market, 2017 – 2028 (USD Million)
    4. 2.4. Software
      1. 2.4.1. Global Software Digital Pathology Market, 2017 – 2028 (USD Million)
    5. 2.5. Communication Systems
      1. 2.5.1. Global Communication Systems Digital Pathology Market, 2017 – 2028 (USD Million)
    6. 2.6. Storage Systems
      1. 2.6.1. Global Storage Systems Digital Pathology Market, 2017 – 2028 (USD Million)
  3. Chapter 3 Digital Pathology Market – Type Analysis
    1. 3.1. Global Digital Pathology Market – Type Overview
    2. 3.2. Global Digital Pathology Market Share, by Type, 2022 & 2028 (USD Million)
    3. 3.3. Human Pathology
      1. 3.3.1. Global Human Pathology Digital Pathology Market, 2017 – 2028 (USD Million)
    4. 3.4. Veterinary Pathology
      1. 3.4.1. Global Veterinary Pathology Digital Pathology Market, 2017 – 2028 (USD Million)
  4. Chapter 4 Digital Pathology Market – Application Analysis
    1. 4.1. Global Digital Pathology Market – Application Overview
    2. 4.2. Global Digital Pathology Market Share, by Application, 2022 & 2028 (USD Million)
    3. 4.3. Drug Discovery
      1. 4.3.1. Global Drug Discovery Digital Pathology Market, 2017 – 2028 (USD Million)
    4. 4.4. Disease Diagnosis
      1. 4.4.1. Global Disease Diagnosis Digital Pathology Market, 2017 – 2028 (USD Million)
    5. 4.5. Training & Education
      1. 4.5.1. Global Training & Education Digital Pathology Market, 2017 – 2028 (USD Million)
    6. 4.6. Tele-consultation
      1. 4.6.1. Global Tele-consultation Digital Pathology Market, 2017 – 2028 (USD Million)
  5. Chapter 5 Digital Pathology Market – End User Analysis
    1. 5.1. Global Digital Pathology Market – End User Overview
    2. 5.2. Global Digital Pathology Market Share, by End User, 2022 & 2028 (USD Million)
    3. 5.3. Hospitals
      1. 5.3.1. Global Hospitals Digital Pathology Market, 2017 – 2028 (USD Million)
    4. 5.4. Pharmaceutical & Biotechnology Companies
      1. 5.4.1. Global Pharmaceutical & Biotechnology Companies Digital Pathology Market, 2017 – 2028 (USD Million)
    5. 5.5. Diagnostic Labs
      1. 5.5.1. Global Diagnostic Labs Digital Pathology Market, 2017 – 2028 (USD Million)
    6. 5.6. Academic & Research Institutes
      1. 5.6.1. Global Academic & Research Institutes Digital Pathology Market, 2017 – 2028 (USD Million)
  6. Chapter 6 Digital Pathology Market – Regional Analysis
    1. 6.1. Global Digital Pathology Market Regional Overview
    2. 6.2. Global Digital Pathology Market Share, by Region, 2022 & 2028 (USD Million)
    3. 6.3. North America
      1. 6.3.1. North America Digital Pathology Market, 2017 – 2028 (USD Million)
        1. 6.3.1.1. North America Digital Pathology Market, by Country, 2017 - 2028 (USD Million)
      2. 6.3.2. North America Digital Pathology Market, by Product, 2017 – 2028
        1. 6.3.2.1. North America Digital Pathology Market, by Product, 2017 – 2028 (USD Million)
      3. 6.3.3. North America Digital Pathology Market, by Type, 2017 – 2028
        1. 6.3.3.1. North America Digital Pathology Market, by Type, 2017 – 2028 (USD Million)
      4. 6.3.4. North America Digital Pathology Market, by Application, 2017 – 2028
        1. 6.3.4.1. North America Digital Pathology Market, by Application, 2017 – 2028 (USD Million)
      5. 6.3.5. North America Digital Pathology Market, by End User, 2017 – 2028
        1. 6.3.5.1. North America Digital Pathology Market, by End User, 2017 – 2028 (USD Million)
      6. 6.3.6. U.S.
        1. 6.3.6.1. U.S. Digital Pathology Market, 2017 – 2028 (USD Million)
      7. 6.3.7. Canada
        1. 6.3.7.1. Canada Digital Pathology Market, 2017 – 2028 (USD Million)
    4. 6.4. Europe
      1. 6.4.1. Europe Digital Pathology Market, 2017 – 2028 (USD Million)
        1. 6.4.1.1. Europe Digital Pathology Market, by Country, 2017 - 2028 (USD Million)
      2. 6.4.2. Europe Digital Pathology Market, by Product, 2017 – 2028
        1. 6.4.2.1. Europe Digital Pathology Market, by Product, 2017 – 2028 (USD Million)
      3. 6.4.3. Europe Digital Pathology Market, by Type, 2017 – 2028
        1. 6.4.3.1. Europe Digital Pathology Market, by Type, 2017 – 2028 (USD Million)
      4. 6.4.4. Europe Digital Pathology Market, by Application, 2017 – 2028
        1. 6.4.4.1. Europe Digital Pathology Market, by Application, 2017 – 2028 (USD Million)
      5. 6.4.5. Europe Digital Pathology Market, by End User, 2017 – 2028
        1. 6.4.5.1. Europe Digital Pathology Market, by End User, 2017 – 2028 (USD Million)
      6. 6.4.6. Germany
        1. 6.4.6.1. Germany Digital Pathology Market, 2017 – 2028 (USD Million)
      7. 6.4.7. France
        1. 6.4.7.1. France Digital Pathology Market, 2017 – 2028 (USD Million)
      8. 6.4.8. U.K.
        1. 6.4.8.1. U.K. Digital Pathology Market, 2017 – 2028 (USD Million)
      9. 6.4.9. Italy
        1. 6.4.9.1. Italy Digital Pathology Market, 2017 – 2028 (USD Million)
      10. 6.4.10. Spain
        1. 6.4.10.1. Spain Digital Pathology Market, 2017 – 2028 (USD Million)
      11. 6.4.11. Rest of Europe
        1. 6.4.11.1. Rest of Europe Digital Pathology Market, 2017 – 2028 (USD Million)
    5. 6.5. Asia Pacific
      1. 6.5.1. Asia Pacific Digital Pathology Market, 2017 – 2028 (USD Million)
        1. 6.5.1.1. Asia Pacific Digital Pathology Market, by Country, 2017 - 2028 (USD Million)
      2. 6.5.2. Asia Pacific Digital Pathology Market, by Product, 2017 – 2028
        1. 6.5.2.1. Asia Pacific Digital Pathology Market, by Product, 2017 – 2028 (USD Million)
      3. 6.5.3. Asia Pacific Digital Pathology Market, by Type, 2017 – 2028
        1. 6.5.3.1. Asia Pacific Digital Pathology Market, by Type, 2017 – 2028 (USD Million)
      4. 6.5.4. Asia Pacific Digital Pathology Market, by Application, 2017 – 2028
        1. 6.5.4.1. Asia Pacific Digital Pathology Market, by Application, 2017 – 2028 (USD Million)
      5. 6.5.5. Asia Pacific Digital Pathology Market, by End User, 2017 – 2028
        1. 6.5.5.1. Asia Pacific Digital Pathology Market, by End User, 2017 – 2028 (USD Million)
      6. 6.5.6. China
        1. 6.5.6.1. China Digital Pathology Market, 2017 – 2028 (USD Million)
      7. 6.5.7. Japan
        1. 6.5.7.1. Japan Digital Pathology Market, 2017 – 2028 (USD Million)
      8. 6.5.8. India
        1. 6.5.8.1. India Digital Pathology Market, 2017 – 2028 (USD Million)
      9. 6.5.9. South Korea
        1. 6.5.9.1. South Korea Digital Pathology Market, 2017 – 2028 (USD Million)
      10. 6.5.10. South-East Asia
        1. 6.5.10.1. South-East Asia Digital Pathology Market, 2017 – 2028 (USD Million)
      11. 6.5.11. Rest of Asia Pacific
        1. 6.5.11.1. Rest of Asia Pacific Digital Pathology Market, 2017 – 2028 (USD Million)
    6. 6.6. Latin America
      1. 6.6.1. Latin America Digital Pathology Market, 2017 – 2028 (USD Million)
        1. 6.6.1.1. Latin America Digital Pathology Market, by Country, 2017 - 2028 (USD Million)
      2. 6.6.2. Latin America Digital Pathology Market, by Product, 2017 – 2028
        1. 6.6.2.1. Latin America Digital Pathology Market, by Product, 2017 – 2028 (USD Million)
      3. 6.6.3. Latin America Digital Pathology Market, by Type, 2017 – 2028
        1. 6.6.3.1. Latin America Digital Pathology Market, by Type, 2017 – 2028 (USD Million)
      4. 6.6.4. Latin America Digital Pathology Market, by Application, 2017 – 2028
        1. 6.6.4.1. Latin America Digital Pathology Market, by Application, 2017 – 2028 (USD Million)
      5. 6.6.5. Latin America Digital Pathology Market, by End User, 2017 – 2028
        1. 6.6.5.1. Latin America Digital Pathology Market, by End User, 2017 – 2028 (USD Million)
      6. 6.6.6. Brazil
        1. 6.6.6.1. Brazil Digital Pathology Market, 2017 – 2028 (USD Million)
      7. 6.6.7. Mexico
        1. 6.6.7.1. Mexico Digital Pathology Market, 2017 – 2028 (USD Million)
      8. 6.6.8. Rest of Latin America
        1. 6.6.8.1. Rest of Latin America Digital Pathology Market, 2017 – 2028 (USD Million)
    7. 6.7. The Middle-East and Africa
      1. 6.7.1. The Middle-East and Africa Digital Pathology Market, 2017 – 2028 (USD Million)
        1. 6.7.1.1. The Middle-East and Africa Digital Pathology Market, by Country, 2017 - 2028 (USD Million)
      2. 6.7.2. The Middle-East and Africa Digital Pathology Market, by Product, 2017 – 2028
        1. 6.7.2.1. The Middle-East and Africa Digital Pathology Market, by Product, 2017 – 2028 (USD Million)
      3. 6.7.3. The Middle-East and Africa Digital Pathology Market, by Type, 2017 – 2028
        1. 6.7.3.1. The Middle-East and Africa Digital Pathology Market, by Type, 2017 – 2028 (USD Million)
      4. 6.7.4. The Middle-East and Africa Digital Pathology Market, by Application, 2017 – 2028
        1. 6.7.4.1. The Middle-East and Africa Digital Pathology Market, by Application, 2017 – 2028 (USD Million)
      5. 6.7.5. The Middle-East and Africa Digital Pathology Market, by End User, 2017 – 2028
        1. 6.7.5.1. The Middle-East and Africa Digital Pathology Market, by End User, 2017 – 2028 (USD Million)
      6. 6.7.6. GCC Countries
        1. 6.7.6.1. GCC Countries Digital Pathology Market, 2017 – 2028 (USD Million)
      7. 6.7.7. South Africa
        1. 6.7.7.1. South Africa Digital Pathology Market, 2017 – 2028 (USD Million)
      8. 6.7.8. Rest of Middle-East Africa
        1. 6.7.8.1. Rest of Middle-East Africa Digital Pathology Market, 2017 – 2028 (USD Million)
  7. Chapter 7 Digital Pathology Market – Competitive Landscape
    1. 7.1. Competitor Market Share – Revenue
    2. 7.2. Market Concentration Rate Analysis, Top 3 and Top 5 Players
    3. 7.3. Strategic Developments
      1. 7.3.1. Acquisitions and Mergers
      2. 7.3.2. New Products
      3. 7.3.3. Research & Development Activities
  8. Chapter 8 Company Profiles
    1. 8.1. Koninklijke Philips N.V
      1. 8.1.1. Company Overview
      2. 8.1.2. Product/Service Portfolio
      3. 8.1.3. Koninklijke Philips N.V Sales, Revenue, and Gross Margin
      4. 8.1.4. Koninklijke Philips N.V Revenue and Growth Rate
      5. 8.1.5. Koninklijke Philips N.V Market Share
      6. 8.1.6. Recent Initiatives, Funding/VC Activities, and Technological Innovations
    2. 8.2. Hamamatsu Photonics
      1. 8.2.1. Company Overview
      2. 8.2.2. Product/Service Portfolio
      3. 8.2.3. Hamamatsu Photonics Sales, Revenue, and Gross Margin
      4. 8.2.4. Hamamatsu Photonics Revenue and Growth Rate
      5. 8.2.5. Hamamatsu Photonics Market Share
      6. 8.2.6. Recent Initiatives, Funding/VC Activities, and Technological Innovations
    3. 8.3. Leica Biosystems
      1. 8.3.1. Company Overview
      2. 8.3.2. Product/Service Portfolio
      3. 8.3.3. Leica Biosystems Sales, Revenue, and Gross Margin
      4. 8.3.4. Leica Biosystems Revenue and Growth Rate
      5. 8.3.5. Leica Biosystems Market Share
      6. 8.3.6. Recent Initiatives, Funding/VC Activities, and Technological Innovations
    4. 8.4. Visiopharm A/S
      1. 8.4.1. Company Overview
      2. 8.4.2. Product/Service Portfolio
      3. 8.4.3. Visiopharm A/S Sales, Revenue, and Gross Margin
      4. 8.4.4. Visiopharm A/S Revenue and Growth Rate
      5. 8.4.5. Visiopharm A/S Market Share
      6. 8.4.6. Recent Initiatives, Funding/VC Activities, and Technological Innovations
    5. 8.5. Corista
      1. 8.5.1. Company Overview
      2. 8.5.2. Product/Service Portfolio
      3. 8.5.3. Corista Sales, Revenue, and Gross Margin
      4. 8.5.4. Corista Revenue and Growth Rate
      5. 8.5.5. Corista Market Share
      6. 8.5.6. Recent Initiatives, Funding/VC Activities, and Technological Innovations
    6. 8.6. Indica Labs
      1. 8.6.1. Company Overview
      2. 8.6.2. Product/Service Portfolio
      3. 8.6.3. Indica Labs Sales, Revenue, and Gross Margin
      4. 8.6.4. Indica Labs Revenue and Growth Rate
      5. 8.6.5. Indica Labs Market Share
      6. 8.6.6. Recent Initiatives, Funding/VC Activities, and Technological Innovations
    7. 8.7. OptraSCAN
      1. 8.7.1. Company Overview
      2. 8.7.2. Product/Service Portfolio
      3. 8.7.3. OptraSCAN Sales, Revenue, and Gross Margin
      4. 8.7.4. OptraSCAN Revenue and Growth Rate
      5. 8.7.5. OptraSCAN Market Share
      6. 8.7.6. Recent Initiatives, Funding/VC Activities, and Technological Innovations
    8. 8.8. Glencoe Software
      1. 8.8.1. Company Overview
      2. 8.8.2. Product/Service Portfolio
      3. 8.8.3. Glencoe Software Sales, Revenue, and Gross Margin
      4. 8.8.4. Glencoe Software Revenue and Growth Rate
      5. 8.8.5. Glencoe Software Market Share
      6. 8.8.6. Recent Initiatives, Funding/VC Activities, and Technological Innovations
    9. 8.9. InspirataInc
      1. 8.9.1. Company Overview
      2. 8.9.2. Product/Service Portfolio
      3. 8.9.3. InspirataInc Sales, Revenue, and Gross Margin
      4. 8.9.4. InspirataInc Revenue and Growth Rate
      5. 8.9.5. InspirataInc Market Share
      6. 8.9.6. Recent Initiatives, Funding/VC Activities, and Technological Innovations
    10. 8.10. Mikroscan Technologies
      1. 8.10.1. Company Overview
      2. 8.10.2. Product/Service Portfolio
      3. 8.10.3. Mikroscan Technologies Sales, Revenue, and Gross Margin
      4. 8.10.4. Mikroscan Technologies Revenue and Growth Rate
      5. 8.10.5. Mikroscan Technologies Market Share
      6. 8.10.6. Recent Initiatives, Funding/VC Activities, and Technological Innovations
    11. 8.11. ProsciaInc
      1. 8.11.1. Company Overview
      2. 8.11.2. Product/Service Portfolio
      3. 8.11.3. ProsciaInc Sales, Revenue, and Gross Margin
      4. 8.11.4. ProsciaInc Revenue and Growth Rate
      5. 8.11.5. ProsciaInc Market Share
      6. 8.11.6. Recent Initiatives, Funding/VC Activities, and Technological Innovations
    12. 8.12. Kanteron Systems
      1. 8.12.1. Company Overview
      2. 8.12.2. Product/Service Portfolio
      3. 8.12.3. Kanteron Systems Sales, Revenue, and Gross Margin
      4. 8.12.4. Kanteron Systems Revenue and Growth Rate
      5. 8.12.5. Kanteron Systems Market Share
      6. 8.12.6. Recent Initiatives, Funding/VC Activities, and Technological Innovations
    13. 8.13. Roche
      1. 8.13.1. Company Overview
      2. 8.13.2. Product/Service Portfolio
      3. 8.13.3. Roche Sales, Revenue, and Gross Margin
      4. 8.13.4. Roche Revenue and Growth Rate
      5. 8.13.5. Roche Market Share
      6. 8.13.6. Recent Initiatives, Funding/VC Activities, and Technological Innovations
    14. 8.14. Apollo Enterprise Imaging
      1. 8.14.1. Company Overview
      2. 8.14.2. Product/Service Portfolio
      3. 8.14.3. Apollo Enterprise Imaging Sales, Revenue, and Gross Margin
      4. 8.14.4. Apollo Enterprise Imaging Revenue and Growth Rate
      5. 8.14.5. Apollo Enterprise Imaging Market Share
      6. 8.14.6. Recent Initiatives, Funding/VC Activities, and Technological Innovations
    15. 8.15. Sectra AB
      1. 8.15.1. Company Overview
      2. 8.15.2. Product/Service Portfolio
      3. 8.15.3. Sectra AB Sales, Revenue, and Gross Margin
      4. 8.15.4. Sectra AB Revenue and Growth Rate
      5. 8.15.5. Sectra AB Market Share
      6. 8.15.6. Recent Initiatives, Funding/VC Activities, and Technological Innovations
    16. 8.16. Huron Digital Pathology
      1. 8.16.1. Company Overview
      2. 8.16.2. Product/Service Portfolio
      3. 8.16.3. Huron Digital Pathology Sales, Revenue, and Gross Margin
      4. 8.16.4. Huron Digital Pathology Revenue and Growth Rate
      5. 8.16.5. Huron Digital Pathology Market Share
      6. 8.16.6. Recent Initiatives, Funding/VC Activities, and Technological Innovations
  9. Chapter 9 Digital Pathology — Industry Analysis
    1. 9.1. Introduction and Taxonomy
    2. 9.2. Digital Pathology Market – Key Trends
      1. 9.2.1. Market Drivers
      2. 9.2.2. Market Restraints
      3. 9.2.3. Market Opportunities
    3. 9.3. Value Chain Analysis
    4. 9.4. Key Mandates and Regulations
    5. 9.5. Technology Roadmap and Timeline
    6. 9.6. Digital Pathology Market – Attractiveness Analysis
      1. 9.6.1. By Product
      2. 9.6.2. By Type
      3. 9.6.3. By Application
      4. 9.6.4. By End User
      5. 9.6.5. By Region
  10. Chapter 10 Industrial Chain, Sourcing Strategy, and Downstream Buyers
    1. 10.1. Digital Pathology Industrial Chain Analysis
    2. 10.2. Downstream Buyers
    3. 10.3. Distributors/Traders List
  11. Chapter 11 Marketing Strategy Analysis
    1. 11.1. Marketing Channel
    2. 11.2. Direct Marketing
    3. 11.3. Indirect Marketing
    4. 11.4. Marketing Channel Development Trends
    5. 11.5. Economic/Political Environmental Change
  12. Chapter 12 Report Conclusion & Key Insights
    1. 12.1. Key Insights from Primary Interviews &Surveys Respondents
    2. 12.2. Key Takeaways from Analysts, Consultants, and Industry Leaders
  13. Chapter 13 Research Approach & Methodology
    1. 13.1. Report Description
    2. 13.2. Research Scope
    3. 13.3. Research Methodology
      1. 13.3.1. Secondary Research
      2. 13.3.2. Primary Research
      3. 13.3.3. Statistical Models
        1. 13.3.3.1. Company Share Analysis Model
        2. 13.3.3.2. Revenue Based Modeling
      4. 13.3.4. Research Limitations

      List of Figures

      Fig.1	Product Picture of Digital Pathology
      Fig.2	Global Digital Pathology Market, 2017 – 2028 (USD Million)
      Fig.3	Global Digital Pathology Market Absolute Revenue Opportunity, 2017 – 2028 (USD Million)
      Fig.4	Global Digital Pathology Market Incremental Revenue Opportunity, 2022 – 2028 (USD Million)
      Fig.5	Global Digital Pathology Market Share, by Product, 2022 & 2028 (USD Million)
      Fig.6	Global Scanners Digital Pathology Market, 2017 – 2028 (USD Million)
      Fig.7	Global Software Digital Pathology Market, 2017 – 2028 (USD Million)
      Fig.8	Global Communication Systems Digital Pathology Market, 2017 – 2028 (USD Million)
      Fig.9	Global Storage Systems Digital Pathology Market, 2017 – 2028 (USD Million)
      Fig.10	Global Digital Pathology Market Share, by Type, 2022 & 2028 (USD Million)
      Fig.11	Global Human Pathology Digital Pathology Market, 2017 – 2028 (USD Million)
      Fig.12	Global Veterinary Pathology Digital Pathology Market, 2017 – 2028 (USD Million)
      Fig.13	Global Digital Pathology Market Share, by Application, 2022 & 2028 (USD Million)
      Fig.14	Global Drug Discovery Digital Pathology Market, 2017 – 2028 (USD Million)
      Fig.15	Global Disease Diagnosis Digital Pathology Market, 2017 – 2028 (USD Million)
      Fig.16	Global Training & Education Digital Pathology Market, 2017 – 2028 (USD Million)
      Fig.17	Global Tele-consultation Digital Pathology Market, 2017 – 2028 (USD Million)
      Fig.18	Global Digital Pathology Market Share, by End User, 2022 & 2028 (USD Million)
      Fig.19	Global Hospitals Digital Pathology Market, 2017 – 2028 (USD Million)
      Fig.20	Global Pharmaceutical & Biotechnology Companies Digital Pathology Market, 2017 – 2028 (USD Million)
      Fig.21	Global Diagnostic Labs Digital Pathology Market, 2017 – 2028 (USD Million)
      Fig.22	Global Academic & Research Institutes Digital Pathology Market, 2017 – 2028 (USD Million)
      Fig.23	Global Digital Pathology Market Share, by Region, 2022 & 2028 (USD Million)
      Fig.24	North America Digital Pathology Market, 2017 – 2028 (USD Million)
      Fig.25	U.S. Digital Pathology Market, 2017 – 2028 (USD Million)
      Fig.26	Canada Digital Pathology Market, 2017 – 2028 (USD Million)
      Fig.27	Europe Digital Pathology Market, 2017 – 2028 (USD Million)
      Fig.28	Germany Digital Pathology Market, 2017 – 2028 (USD Million)
      Fig.29	France Digital Pathology Market, 2017 – 2028 (USD Million)
      Fig.30	U.K. Digital Pathology Market, 2017 – 2028 (USD Million)
      Fig.31	Italy Digital Pathology Market, 2017 – 2028 (USD Million)
      Fig.32	Spain Digital Pathology Market, 2017 – 2028 (USD Million)
      Fig.33	Rest of Europe Digital Pathology Market, 2017 – 2028 (USD Million)
      Fig.34	Asia Pacific Digital Pathology Market, 2017 – 2028 (USD Million)
      Fig.35	China Digital Pathology Market, 2017 – 2028 (USD Million)
      Fig.36	Japan Digital Pathology Market, 2017 – 2028 (USD Million)
      Fig.37	India Digital Pathology Market, 2017 – 2028 (USD Million)
      Fig.38	South  Korea Digital Pathology Market, 2017 – 2028 (USD Million)
      Fig.39	South-East Asia Digital Pathology Market, 2017 – 2028 (USD Million)
      Fig.40	Rest of Asia Pacific Digital Pathology Market, 2017 – 2028 (USD Million)
      Fig.41	Latin America Digital Pathology Market, 2017 – 2028 (USD Million)
      Fig.42	Brazil Digital Pathology Market, 2017 – 2028 (USD Million)
      Fig.43	Mexico Digital Pathology Market, 2017 – 2028 (USD Million)
      Fig.44	Rest of Latin America Digital Pathology Market, 2017 – 2028 (USD Million)
      Fig.45	The Middle-East and Africa Digital Pathology Market, 2017 – 2028 (USD Million)
      Fig.46	GCC Countries Digital Pathology Market, 2017 – 2028 (USD Million)
      Fig.47	South Africa Digital Pathology Market, 2017 – 2028 (USD Million)
      Fig.48	Rest of Middle-East Africa Digital Pathology Market, 2017 – 2028 (USD Million)
      Fig.49	Competitor Market Share – Revenue
      Fig.50	Koninklijke Philips N.V Revenue and Growth Rate
      Fig.51	Koninklijke Philips N.V Market Share
      Fig.52	Hamamatsu Photonics Revenue and Growth Rate
      Fig.53	Hamamatsu Photonics Market Share
      Fig.54	Leica Biosystems Revenue and Growth Rate
      Fig.55	Leica Biosystems Market Share
      Fig.56	Visiopharm A/S Revenue and Growth Rate
      Fig.57	Visiopharm A/S Market Share
      Fig.58	Corista Revenue and Growth Rate
      Fig.59	Corista Market Share
      Fig.60	Indica Labs Revenue and Growth Rate
      Fig.61	Indica Labs Market Share
      Fig.62	OptraSCAN Revenue and Growth Rate
      Fig.63	OptraSCAN Market Share
      Fig.64	Glencoe Software Revenue and Growth Rate
      Fig.65	Glencoe Software Market Share
      Fig.66	InspirataInc Revenue and Growth Rate
      Fig.67	InspirataInc Market Share
      Fig.68	Mikroscan Technologies Revenue and Growth Rate
      Fig.69	Mikroscan Technologies Market Share
      Fig.70	ProsciaInc Revenue and Growth Rate
      Fig.71	ProsciaInc Market Share
      Fig.72	Kanteron Systems Revenue and Growth Rate
      Fig.73	Kanteron Systems Market Share
      Fig.74	Roche Revenue and Growth Rate
      Fig.75	Roche Market Share
      Fig.76	Apollo Enterprise Imaging Revenue and Growth Rate
      Fig.77	Apollo Enterprise Imaging Market Share
      Fig.78	Sectra AB Revenue and Growth Rate
      Fig.79	Sectra AB Market Share
      Fig.80	Huron Digital Pathology Revenue and Growth Rate
      Fig.81	Huron Digital Pathology Market Share
      Fig.82	Market Dynamics
      Fig.83	Global Digital Pathology – Value Chain Analysis
      Fig.84	Key Mandates and Regulations
      Fig.85	Technology Roadmap and Timeline
      Fig.86	Market Attractiveness Analysis – By Product
      Fig.87	Market Attractiveness Analysis – By Type
      Fig.88	Market Attractiveness Analysis – By Application
      Fig.89	Market Attractiveness Analysis – By End User
      Fig.90	Market Attractiveness Analysis – By Region
      Fig.91	Digital Pathology Industrial Chain Analysis
      Fig.92	Market Channels
      Fig.93	Marketing Channel Development Trend
      Fig.94	Growth in World Gross Product, 2008-2018
      

      List of Tables

      Table 1	Global Digital Pathology Market, 2022 & 2028 (USD Million)
      Table 2	Global Digital Pathology Market, by Product, 2017 – 2028 (USD Million)
      Table 3	Global Digital Pathology Market, by Type, 2017 – 2028 (USD Million)
      Table 4	Global Digital Pathology Market, by Application, 2017 – 2028 (USD Million)
      Table 5	Global Digital Pathology Market, by End User, 2017 – 2028 (USD Million)
      Table 6	Global Digital Pathology Market, by Region, 2017 – 2028 (USD Million)
      Table 7	North America Digital Pathology Market, by Country, 2017 – 2028 (USD Million)
      Table 8	North America Digital Pathology Market, by Product, 2017 – 2028 (USD Million)
      Table 9	North America Digital Pathology Market, by Type, 2017 – 2028 (USD Million)
      Table 10 North America Digital Pathology Market, by Application, 2017 – 2028 (USD Million)
      Table 11 North America Digital Pathology Market, by End User, 2017 – 2028 (USD Million)
      Table 12 Europe Digital Pathology Market, by Country, 2017 – 2028 (USD Million)
      Table 13 Europe Digital Pathology Market, by Product, 2017 – 2028 (USD Million)
      Table 14 Europe Digital Pathology Market, by Type, 2017 – 2028 (USD Million)
      Table 15 Europe Digital Pathology Market, by Application, 2017 – 2028 (USD Million)
      Table 16 Europe Digital Pathology Market, by End User, 2017 – 2028 (USD Million)
      Table 17 Asia Pacific Digital Pathology Market, by Country, 2017 – 2028 (USD Million)
      Table 18 Asia Pacific Digital Pathology Market, by Product, 2017 – 2028 (USD Million)
      Table 19 Asia Pacific Digital Pathology Market, by Type, 2017 – 2028 (USD Million)
      Table 20 Asia Pacific Digital Pathology Market, by Application, 2017 – 2028 (USD Million)
      Table 21 Asia Pacific Digital Pathology Market, by End User, 2017 – 2028 (USD Million)
      Table 22 Latin America Digital Pathology Market, by Country, 2017 – 2028 (USD Million)
      Table 23 Latin America Digital Pathology Market, by Product, 2017 – 2028 (USD Million)
      Table 24 Latin America Digital Pathology Market, by Type, 2017 – 2028 (USD Million)
      Table 25 Latin America Digital Pathology Market, by Application, 2017 – 2028 (USD Million)
      Table 26 Latin America Digital Pathology Market, by End User, 2017 – 2028 (USD Million)
      Table 27 The Middle-East and Africa Digital Pathology Market, by Country, 2017 – 2028 (USD Million)
      Table 28 The Middle-East and Africa Digital Pathology Market, by Product, 2017 – 2028 (USD Million)
      Table 29 The Middle-East and Africa Digital Pathology Market, by Type, 2017 – 2028 (USD Million)
      Table 30 The Middle-East and Africa Digital Pathology Market, by Application, 2017 – 2028 (USD Million)
      Table 31 The Middle-East and Africa Digital Pathology Market, by End User, 2017 – 2028 (USD Million)
      Table 32 Global Digital Pathology Market - Company Revenue Analysis, 2017 – 2020 (USD Million)
      Table 33 Global Digital Pathology Market - Company Revenue Share Analysis, 2017 – 2020 (%)
      Table 34 Acquisitions and Mergers
      Table 35 Market Drivers – Impact Analysis
      Table 36 Market Restraints
      Table 37 Market Opportunities
      Table 38 Major Buyers of Digital Pathology
      Table 39 Distributors/Traders of Digital Pathology by Region
      

Industry Major Market Players

  • Koninklijke Philips N.V.
  • Hamamatsu Photonics
  • Leica Biosystems
  • Visiopharm A/S
  • Corista
  • Indica Labs
  • OptraSCAN
  • Glencoe Software
  • Inspirata Inc.
  • Mikroscan Technologies
  • Proscia Inc.
  • Kanteron Systems
  • Roche
  • Apollo Enterprise Imaging
  • Sectra AB
  • Huron Digital Pathology