Search Market Research Report

Discover Our Latest Reports
Discover Our Featured Reports
Discover Top Selling Reports

Calcium Carbonate Market Size, Share & Trends Analysis Forecast 2021-2026

report img

Calcium Carbonate Market By Application (Paper, Paints & Coatings, Plastics, Adhesives & Sealants, & Others), And By Regions - Global & Regional Industry Perspective, Comprehensive Analysis, and Forecast 2021 – 2026

Industry Insights

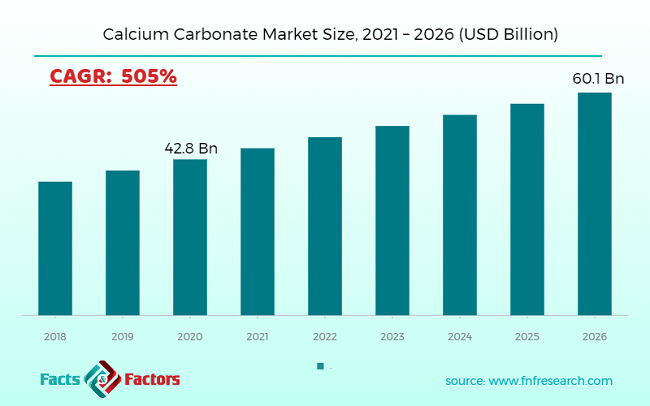
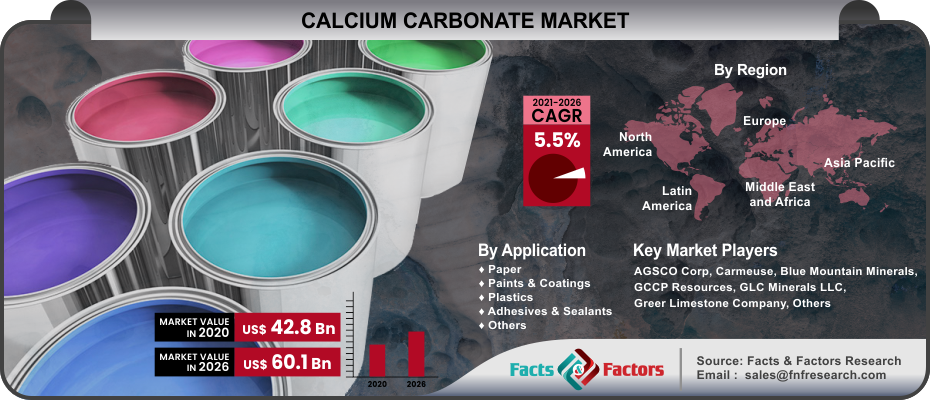
[189+ Pages Report] The latest finding surrounding the “Global Calcium Carbonate Market” published by Facts & Factors offers a neatly packaged and comprehensive read. In this report, the global calcium carbonate market surrounding calcium carbonate is projected to value around USD 60.1 Billion in the year 2026 with a growth rate of 5.5% CAGR from an initial value of USD 42.8 Billion in the year 2020.

Calcium Carbonate Market Size

To know more about this report | Request Free Sample Copy

logoMarket Overview

Calcium carbonate is a chemical composition-based compound that is based on the formulation of CaCo3 that is found commonly in rocks as the most notable source such as minerals calcite and aragonite. Calcium carbonate is also the main component found within eggshells, snail shells, seashells, and pearls, among others. In the medical world, calcium carbonate is used as a calcium supplement or as an antacid; however, irregular consumption is often deemed hazardous and can often cause hypercalcemia and other forms of digestive issues.

logoIndustry Growth Factors

The primary driving forces for the global calcium carbonate market can be attributed to the rising demand from the paper and plastic end-use sector coupled with the usage of the latter in a filler material to name a few. Additionally, rising demand from the sectors of paints and coating and adhesive and sealants industries coupled with rising consumer awareness will increase the footprint of the global calcium carbonate market during the advent of the forecast period. Moreover, rising demand for electric vehicles coupled with increasing demand for cleanliness will boost the growth of the global calcium carbonate market during the advent of the forecast period.

The global calcium carbonate market will be driven by rising demands from the water treatment measures coupled with increased consumer demands in terms of health and wellbeing to name a few. Factors such as increased consumption of dietary supplements coupled with rising instances of calcium deficiencies such as hypocalcemia will fuel the growth of the global calcium carbonate market during the advent of the forecast period. However, various health concerns that can be pertinent to the product will further push the growth of the global calcium carbonate market during the advent of the forecast period.

Calcium Carbonate Market

To know more about this report | Request Free Sample Copy

logoSegmentation Analysis

The global calcium carbonate market is segmented into application and region.

Based on application, the global calcium carbonate market is divided into paper, paints & coatings, plastics, adhesives & sealants, and others. The segment pertaining to paper is expected to witness the largest market share during the advent of the forecast period owing to the integration of calcium carbonate as a filler material in a paper gulp and increased functionality as a coating pigment to name a few. Additionally, the addition of calcium carbonate pertains to increased brightness and opacity of the paper which will cement the dominant market position during the advent of the forecast period. Paintings & coatings are expected to occupy a substantial market share during the forecast period owing to rising application lists such a reducing and enhancing gloss, extender-based properties, and rheology modifier to name a few.

logo Report Scope

Report Attribute

Details

Market Size in 2020

USD 42.8 Billion

Projected Market Size in 2026

USD 60.1 Billion

CAGR Growth Rate

5.5% CAGR

Base Year

2020

Forecast Years

2021-2026

Key Market Players

AGSCO Corp, Carmeuse, Blue Mountain Minerals, GCCP Resources, GLC Minerals LLC, Greer Limestone Company, Gulshan Polyols Ltd, ILC Resources, Imerys, J.M Huber Corp, LafargeHolcium, Midwest Calcium Carbonates, Mineral Technologies, NALC LLC, Omya, The National Lime & Stone Company, and the United States Lime & Material, Inc., among others.

Key Segment

By Type, By Application, and By Region

Major Regions Covered

North America, Europe, Asia Pacific, Latin America, and Middle East & Africa

Purchase Options

Request customized purchase options to meet your research needs. Explore purchase options

logo Regional Analysis

Asia-Pacific is expected to witness the largest market share during the advent of the forecast period owing to rising investment measures in the infrastructure development and manufacturing sector coupled with increased demands for cleanliness and hygiene measures to name a few. The rising automotive sector in the region coupled with increased demands for paints and coatings will further increase the footprint of the calcium carbonate market during the advent of the forecast period. North America is expected to witness a substantial market share during the advent of the forecast period owing to the rising sectors from medical, packaging, and DIY kits coupled with rising products in terms of adhesives and paper-based sector to name a few. Moreover, rising collaborations and increasing production capabilities will push the dominant market position of the latter region during the advent of the forecast period.

logo Competitive Players

The key market participants for the global calcium carbonate market are :

  • AGSCO Corp
  • Carmeuse
  • Blue Mountain Minerals
  • GCCP Resources
  • GLC Minerals LLC
  • Greer Limestone Company
  • Gulshan Polyols Ltd
  • ILC Resources
  • Imerys
  • J.M Huber Corp
  • LafargeHolcium
  • Midwest Calcium Carbonates
  • Mineral Technologies
  • NALC LLC
  • Omya
  • The National Lime & Stone Company
  • United States Lime & Material Inc.

logo By Application Segment Analysis

  • Paper
  • Paints & Coatings
  • Plastics
  • Adhesives & Sealants
  • Others

logo By Regional Segment Analysis

  • North America
    • U.S.
    • Canada
  • Europe
    • UK
    • France
    • Germany
    • Italy
    • Spain
    • Rest of Europe
  • Asia Pacific
    • China
    • Japan
    • India
    • South Korea
    • Southeast Asia
    • Rest of Asia Pacific
  • Latin America
    • Brazil
    • Mexico
    • Rest of Latin America
  • Middle East and Africa
    • GCC Countries
    • South Africa
    • Rest of MEA

Table of Content

  1. Chapter 1 Executive Summary
    1. 1.1. Introduction of Calcium Carbonate
    2. 1.2. Global Calcium Carbonate Market, 2019 & 2026 (USD Billion)
    3. 1.3. Global Calcium Carbonate Market, 2016 – 2026 (USD Billion)
    4. 1.4. Global Calcium Carbonate Market Absolute Revenue Opportunity, 2016 – 2026 (USD Billion)
    5. 1.5. Global Calcium Carbonate Market Incremental Revenue Opportunity, 2020 – 2026 (USD Billion)
  2. Chapter 2 Calcium Carbonate Market – Application Analysis
    1. 2.1. Global Calcium Carbonate Market – Application Overview
    2. 2.2. Global Calcium Carbonate Market Share, by Application, 2019 & 2026 (USD Billion)
    3. 2.3. Paper
      1. 2.3.1. Global Paper Calcium Carbonate Market, 2016 – 2026 (USD Billion)
    4. 2.4. Paints & Coatings
      1. 2.4.1. Global Paints & Coatings Calcium Carbonate Market, 2016 – 2026 (USD Billion)
    5. 2.5. Plastics
      1. 2.5.1. Global Plastics Calcium Carbonate Market, 2016 – 2026 (USD Billion)
    6. 2.6. Adhesives & Sealants
      1. 2.6.1. Global Adhesives & Sealants Calcium Carbonate Market, 2016 – 2026 (USD Billion)
    7. 2.7. Others
      1. 2.7.1. Global Others Calcium Carbonate Market, 2016 – 2026 (USD Billion)
  3. Chapter 3 Calcium Carbonate Market – Regional Analysis
    1. 3.1. Global Calcium Carbonate Market Regional Overview
    2. 3.2. Global Calcium Carbonate Market Share, by Region, 2019 & 2026 (USD Billion)
    3. 3.3. North America
      1. 3.3.1. North America Calcium Carbonate Market, 2016 – 2026 (USD Billion)
        1. 3.3.1.1. North America Calcium Carbonate Market, by Country, 2016 - 2026 (USD Billion)
      2. 3.3.2. North America Calcium Carbonate Market, by Application, 2016 – 2026
        1. 3.3.2.1. North America Calcium Carbonate Market, by Application, 2016 – 2026 (USD Billion)
      3. 3.3.3. U.S.
        1. 3.3.3.1. U.S. Calcium Carbonate Market, 2016 – 2026 (USD Billion)
      4. 3.3.4. Canada
        1. 3.3.4.1. Canada Calcium Carbonate Market, 2016 – 2026 (USD Billion)
    4. 3.4. Europe
      1. 3.4.1. Europe Calcium Carbonate Market, 2016 – 2026 (USD Billion)
        1. 3.4.1.1. Europe Calcium Carbonate Market, by Country, 2016 - 2026 (USD Billion)
      2. 3.4.2. Europe Calcium Carbonate Market, by Application, 2016 – 2026
        1. 3.4.2.1. Europe Calcium Carbonate Market, by Application, 2016 – 2026 (USD Billion)
      3. 3.4.3. Germany
        1. 3.4.3.1. Germany Calcium Carbonate Market, 2016 – 2026 (USD Billion)
      4. 3.4.4. France
        1. 3.4.4.1. France Calcium Carbonate Market, 2016 – 2026 (USD Billion)
      5. 3.4.5. U.K.
        1. 3.4.5.1. U.K. Calcium Carbonate Market, 2016 – 2026 (USD Billion)
      6. 3.4.6. Italy
        1. 3.4.6.1. Italy Calcium Carbonate Market, 2016 – 2026 (USD Billion)
      7. 3.4.7. Spain
        1. 3.4.7.1. Spain Calcium Carbonate Market, 2016 – 2026 (USD Billion)
      8. 3.4.8. Rest of Europe
        1. 3.4.8.1. Rest of Europe Calcium Carbonate Market, 2016 – 2026 (USD Billion)
    5. 3.5. Asia Pacific
      1. 3.5.1. Asia Pacific Calcium Carbonate Market, 2016 – 2026 (USD Billion)
        1. 3.5.1.1. Asia Pacific Calcium Carbonate Market, by Country, 2016 - 2026 (USD Billion)
      2. 3.5.2. Asia Pacific Calcium Carbonate Market, by Application, 2016 – 2026
        1. 3.5.2.1. Asia Pacific Calcium Carbonate Market, by Application, 2016 – 2026 (USD Billion)
      3. 3.5.3. China
        1. 3.5.3.1. China Calcium Carbonate Market, 2016 – 2026 (USD Billion)
      4. 3.5.4. Japan
        1. 3.5.4.1. Japan Calcium Carbonate Market, 2016 – 2026 (USD Billion)
      5. 3.5.5. India
        1. 3.5.5.1. India Calcium Carbonate Market, 2016 – 2026 (USD Billion)
      6. 3.5.6. South Korea
        1. 3.5.6.1. South Korea Calcium Carbonate Market, 2016 – 2026 (USD Billion)
      7. 3.5.7. South-East Asia
        1. 3.5.7.1. South-East Asia Calcium Carbonate Market, 2016 – 2026 (USD Billion)
      8. 3.5.8. Rest of Asia Pacific
        1. 3.5.8.1. Rest of Asia Pacific Calcium Carbonate Market, 2016 – 2026 (USD Billion)
    6. 3.6. Latin America
      1. 3.6.1. Latin America Calcium Carbonate Market, 2016 – 2026 (USD Billion)
        1. 3.6.1.1. Latin America Calcium Carbonate Market, by Country, 2016 - 2026 (USD Billion)
      2. 3.6.2. Latin America Calcium Carbonate Market, by Application, 2016 – 2026
        1. 3.6.2.1. Latin America Calcium Carbonate Market, by Application, 2016 – 2026 (USD Billion)
      3. 3.6.3. Brazil
        1. 3.6.3.1. Brazil Calcium Carbonate Market, 2016 – 2026 (USD Billion)
      4. 3.6.4. Mexico
        1. 3.6.4.1. Mexico Calcium Carbonate Market, 2016 – 2026 (USD Billion)
      5. 3.6.5. Rest of Latin America
        1. 3.6.5.1. Rest of Latin America Calcium Carbonate Market, 2016 – 2026 (USD Billion)
    7. 3.7. The Middle-East and Africa
      1. 3.7.1. The Middle-East and Africa Calcium Carbonate Market, 2016 – 2026 (USD Billion)
        1. 3.7.1.1. The Middle-East and Africa Calcium Carbonate Market, by Country, 2016 - 2026 (USD Billion)
      2. 3.7.2. The Middle-East and Africa Calcium Carbonate Market, by Application, 2016 – 2026
        1. 3.7.2.1. The Middle-East and Africa Calcium Carbonate Market, by Application, 2016 – 2026 (USD Billion)
      3. 3.7.3. GCC Countries
        1. 3.7.3.1. GCC Countries Calcium Carbonate Market, 2016 – 2026 (USD Billion)
      4. 3.7.4. South Africa
        1. 3.7.4.1. South Africa Calcium Carbonate Market, 2016 – 2026 (USD Billion)
      5. 3.7.5. Rest of Middle-East Africa
        1. 3.7.5.1. Rest of Middle-East Africa Calcium Carbonate Market, 2016 – 2026 (USD Billion)
  4. Chapter 4 Calcium Carbonate Market – Competitive Landscape
    1. 4.1. Competitor Market Share – Revenue
    2. 4.2. Market Concentration Rate Analysis, Top 3 and Top 5 Players
    3. 4.3. Strategic Developments
      1. 4.3.1. Acquisitions and Mergers
      2. 4.3.2. New Products
      3. 4.3.3. Research & Development Activities
  5. Chapter 5 Company Profiles
    1. 5.1. AGSCO Corp
      1. 5.1.1. Company Overview
      2. 5.1.2. Product/Service Portfolio
      3. 5.1.3. AGSCO Corp Sales, Revenue, and Gross Margin
      4. 5.1.4. AGSCO Corp Revenue and Growth Rate
      5. 5.1.5. AGSCO Corp Market Share
      6. 5.1.6. Recent Initiatives, Funding/VC Activities, and Technological Innovations
    2. 5.2. Carmeuse
      1. 5.2.1. Company Overview
      2. 5.2.2. Product/Service Portfolio
      3. 5.2.3. Carmeuse Sales, Revenue, and Gross Margin
      4. 5.2.4. Carmeuse Revenue and Growth Rate
      5. 5.2.5. Carmeuse Market Share
      6. 5.2.6. Recent Initiatives, Funding/VC Activities, and Technological Innovations
    3. 5.3. Blue Mountain Minerals
      1. 5.3.1. Company Overview
      2. 5.3.2. Product/Service Portfolio
      3. 5.3.3. Blue Mountain Minerals Sales, Revenue, and Gross Margin
      4. 5.3.4. Blue Mountain Minerals Revenue and Growth Rate
      5. 5.3.5. Blue Mountain Minerals Market Share
      6. 5.3.6. Recent Initiatives, Funding/VC Activities, and Technological Innovations
    4. 5.4. GCCP Resources
      1. 5.4.1. Company Overview
      2. 5.4.2. Product/Service Portfolio
      3. 5.4.3. GCCP Resources Sales, Revenue, and Gross Margin
      4. 5.4.4. GCCP Resources Revenue and Growth Rate
      5. 5.4.5. GCCP Resources Market Share
      6. 5.4.6. Recent Initiatives, Funding/VC Activities, and Technological Innovations
    5. 5.5. GLC Minerals LLC
      1. 5.5.1. Company Overview
      2. 5.5.2. Product/Service Portfolio
      3. 5.5.3. GLC Minerals LLC Sales, Revenue, and Gross Margin
      4. 5.5.4. GLC Minerals LLC Revenue and Growth Rate
      5. 5.5.5. GLC Minerals LLC Market Share
      6. 5.5.6. Recent Initiatives, Funding/VC Activities, and Technological Innovations
    6. 5.6. Greer Limestone Company
      1. 5.6.1. Company Overview
      2. 5.6.2. Product/Service Portfolio
      3. 5.6.3. Greer Limestone Company Sales, Revenue, and Gross Margin
      4. 5.6.4. Greer Limestone Company Revenue and Growth Rate
      5. 5.6.5. Greer Limestone Company Market Share
      6. 5.6.6. Recent Initiatives, Funding/VC Activities, and Technological Innovations
    7. 5.7. Gulshan Polyols Ltd
      1. 5.7.1. Company Overview
      2. 5.7.2. Product/Service Portfolio
      3. 5.7.3. Gulshan Polyols Ltd Sales, Revenue, and Gross Margin
      4. 5.7.4. Gulshan Polyols Ltd Revenue and Growth Rate
      5. 5.7.5. Gulshan Polyols Ltd Market Share
      6. 5.7.6. Recent Initiatives, Funding/VC Activities, and Technological Innovations
    8. 5.8. ILC Resources
      1. 5.8.1. Company Overview
      2. 5.8.2. Product/Service Portfolio
      3. 5.8.3. ILC Resources Sales, Revenue, and Gross Margin
      4. 5.8.4. ILC Resources Revenue and Growth Rate
      5. 5.8.5. ILC Resources Market Share
      6. 5.8.6. Recent Initiatives, Funding/VC Activities, and Technological Innovations
    9. 5.9. Imerys
      1. 5.9.1. Company Overview
      2. 5.9.2. Product/Service Portfolio
      3. 5.9.3. Imerys Sales, Revenue, and Gross Margin
      4. 5.9.4. Imerys Revenue and Growth Rate
      5. 5.9.5. Imerys Market Share
      6. 5.9.6. Recent Initiatives, Funding/VC Activities, and Technological Innovations
      7. 5.10. J.M Huber Corp
      8. 5.10.1. Company Overview
      9. 5.10.2. Product/Service Portfolio
        1. 5.10.3. J.M Huber Corp Sales, Revenue, and Gross Margin
        2. 5.10.4. J.M Huber Corp Revenue and Growth Rate
        3. 5.10.5. J.M Huber Corp Market Share
      10. 5.10.6. Recent Initiatives, Funding/VC Activities, and Technological Innovations
    10. 5.11. LafargeHolcium
      1. 5.11.1. Company Overview
      2. 5.11.2. Product/Service Portfolio
      3. 5.11.3. LafargeHolcium Sales, Revenue, and Gross Margin
      4. 5.11.4. LafargeHolcium Revenue and Growth Rate
      5. 5.11.5. LafargeHolcium Market Share
      6. 5.11.6. Recent Initiatives, Funding/VC Activities, and Technological Innovations
    11. 5.12. Midwest Calcium Carbonates
      1. 5.12.1. Company Overview
      2. 5.12.2. Product/Service Portfolio
      3. 5.12.3. Midwest Calcium Carbonates Sales, Revenue, and Gross Margin
      4. 5.12.4. Midwest Calcium Carbonates Revenue and Growth Rate
      5. 5.12.5. Midwest Calcium Carbonates Market Share
      6. 5.12.6. Recent Initiatives, Funding/VC Activities, and Technological Innovations
    12. 5.13. Mineral Technologies
      1. 5.13.1. Company Overview
      2. 5.13.2. Product/Service Portfolio
      3. 5.13.3. Mineral Technologies Sales, Revenue, and Gross Margin
      4. 5.13.4. Mineral Technologies Revenue and Growth Rate
      5. 5.13.5. Mineral Technologies Market Share
      6. 5.13.6. Recent Initiatives, Funding/VC Activities, and Technological Innovations
    13. 5.14. NALC LLC
      1. 5.14.1. Company Overview
      2. 5.14.2. Product/Service Portfolio
      3. 5.14.3. NALC LLC Sales, Revenue, and Gross Margin
      4. 5.14.4. NALC LLC Revenue and Growth Rate
      5. 5.14.5. NALC LLC Market Share
      6. 5.14.6. Recent Initiatives, Funding/VC Activities, and Technological Innovations
    14. 5.15. Omya
      1. 5.15.1. Company Overview
      2. 5.15.2. Product/Service Portfolio
      3. 5.15.3. Omya Sales, Revenue, and Gross Margin
      4. 5.15.4. Omya Revenue and Growth Rate
      5. 5.15.5. Omya Market Share
      6. 5.15.6. Recent Initiatives, Funding/VC Activities, and Technological Innovations
    15. 5.16. The National Lime & Stone Company
      1. 5.16.1. Company Overview
      2. 5.16.2. Product/Service Portfolio
      3. 5.16.3. The National Lime & Stone Company Sales, Revenue, and Gross Margin
      4. 5.16.4. The National Lime & Stone Company Revenue and Growth Rate
      5. 5.16.5. The National Lime & Stone Company Market Share
      6. 5.16.6. Recent Initiatives, Funding/VC Activities, and Technological Innovations
    16. 5.17. United States Lime & Material Inc
      1. 5.17.1. Company Overview
      2. 5.17.2. Product/Service Portfolio
      3. 5.17.3. United States Lime & Material Inc Sales, Revenue, and Gross Margin
      4. 5.17.4. United States Lime & Material Inc Revenue and Growth Rate
      5. 5.17.5. United States Lime & Material Inc Market Share
      6. 5.17.6. Recent Initiatives, Funding/VC Activities, and Technological Innovations
  6. Chapter 6 Calcium Carbonate — Industry Analysis
    1. 6.1. Introduction and Taxonomy
    2. 6.2. Calcium Carbonate Market – Key Trends
      1. 6.2.1. Market Drivers
      2. 6.2.2. Market Restraints
      3. 6.2.3. Market Opportunities
    3. 6.3. Value Chain Analysis
    4. 6.4. Key Mandates and Regulations
    5. 6.5. Technology Roadmap and Timeline
    6. 6.6. Calcium Carbonate Market – Attractiveness Analysis
      1. 6.6.1. By Application
      2. 6.6.2. By Region
  7. Chapter 7 Industrial Chain, Sourcing Strategy, and Downstream Buyers
    1. 7.1. Calcium Carbonate Industrial Chain Analysis
    2. 7.2. Downstream Buyers
    3. 7.3. Distributors/Traders List
  8. Chapter 8 Marketing Strategy Analysis
    1. 8.1. Marketing Channel
    2. 8.2. Direct Marketing
    3. 8.3. Indirect Marketing
    4. 8.4. Marketing Channel Development Trends
    5. 8.5. Economic/Political Environmental Change
  9. Chapter 9 Report Conclusion & Key Insights
    1. 9.1. Key Insights from Primary Interviews & Surveys Respondents
    2. 9.2. Key Takeaways from Analysts, Consultants, and Industry Leaders
  10. Chapter 10 Research Approach & Methodology
    1. 10.1. Report Description
    2. 10.2. Research Scope
    3. 10.3. Research Methodology
      1. 10.3.1. Secondary Research
      2. 10.3.2. Primary Research
      3. 10.3.3. Statistical Models
        1. 10.3.3.1. Company Share Analysis Model
        2. 10.3.3.2. Revenue Based Modeling
      4. 10.3.4. Research Limitations

      List of Figures

      Fig.1	Product Picture of Calcium Carbonate
      Fig.2	Global Calcium Carbonate Market, 2016 – 2026 (USD Billion)
      Fig.3	Global Calcium Carbonate Market Absolute Revenue Opportunity, 2016 – 2026 (USD Billion)
      Fig.4	Global Calcium Carbonate Market Incremental Revenue Opportunity, 2020 – 2026 (USD Billion)
      Fig.5	Global Calcium Carbonate Market Share, by Application, 2019 & 2026 (USD Billion)
      Fig.6	Global Paper Calcium Carbonate Market, 2016 – 2026 (USD Billion)
      Fig.7	Global Paints & Coatings  Calcium Carbonate Market, 2016 – 2026 (USD Billion)
      Fig.8	Global Plastics  Calcium Carbonate Market, 2016 – 2026 (USD Billion)
      Fig.9	Global Adhesives & Sealants Calcium Carbonate Market, 2016 – 2026 (USD Billion)
      Fig.10	Global Others Calcium Carbonate Market, 2016 – 2026 (USD Billion)
      Fig.11	Global Calcium Carbonate Market Share, by Region, 2019 & 2026 (USD Billion)
      Fig.12	North America Calcium Carbonate Market, 2016 – 2026 (USD Billion)
      Fig.13	U.S. Calcium Carbonate Market, 2016 – 2026 (USD Billion)
      Fig.14	Canada Calcium Carbonate Market, 2016 – 2026 (USD Billion)
      Fig.15	Europe Calcium Carbonate Market, 2016 – 2026 (USD Billion)
      Fig.16	Germany Calcium Carbonate Market, 2016 – 2026 (USD Billion)
      Fig.17	France Calcium Carbonate Market, 2016 – 2026 (USD Billion)
      Fig.18	U.K. Calcium Carbonate Market, 2016 – 2026 (USD Billion)
      Fig.19	Italy Calcium Carbonate Market, 2016 – 2026 (USD Billion)
      Fig.20	Spain Calcium Carbonate Market, 2016 – 2026 (USD Billion)
      Fig.21	Rest of Europe Calcium Carbonate Market, 2016 – 2026 (USD Billion)
      Fig.22	Asia Pacific Calcium Carbonate Market, 2016 – 2026 (USD Billion)
      Fig.23	China Calcium Carbonate Market, 2016 – 2026 (USD Billion)
      Fig.24	Japan Calcium Carbonate Market, 2016 – 2026 (USD Billion)
      Fig.25	India Calcium Carbonate Market, 2016 – 2026 (USD Billion)
      Fig.26	South  Korea Calcium Carbonate Market, 2016 – 2026 (USD Billion)
      Fig.27	South-East Asia Calcium Carbonate Market, 2016 – 2026 (USD Billion)
      Fig.28	Rest of Asia Pacific Calcium Carbonate Market, 2016 – 2026 (USD Billion)
      Fig.29	Latin America Calcium Carbonate Market, 2016 – 2026 (USD Billion)
      Fig.30	Brazil Calcium Carbonate Market, 2016 – 2026 (USD Billion)
      Fig.31	Mexico Calcium Carbonate Market, 2016 – 2026 (USD Billion)
      Fig.32	Rest of Latin America Calcium Carbonate Market, 2016 – 2026 (USD Billion)
      Fig.33	The Middle-East and Africa Calcium Carbonate Market, 2016 – 2026 (USD Billion)
      Fig.34	GCC Countries Calcium Carbonate Market, 2016 – 2026 (USD Billion)
      Fig.35	South Africa Calcium Carbonate Market, 2016 – 2026 (USD Billion)
      Fig.36	Rest of Middle-East Africa Calcium Carbonate Market, 2016 – 2026 (USD Billion)
      Fig.37	Competitor Market Share – Revenue
      Fig.38	AGSCO Corp Revenue and Growth Rate
      Fig.39	AGSCO Corp Market Share
      Fig.40	Carmeuse Revenue and Growth Rate
      Fig.41	Carmeuse Market Share
      Fig.42	Blue Mountain Minerals Revenue and Growth Rate
      Fig.43	Blue Mountain Minerals Market Share
      Fig.44	GCCP Resources Revenue and Growth Rate
      Fig.45	GCCP Resources Market Share
      Fig.46	GLC Minerals LLC Revenue and Growth Rate
      Fig.47	GLC Minerals LLC Market Share
      Fig.48	Greer Limestone Company Revenue and Growth Rate
      Fig.49	Greer Limestone Company Market Share
      Fig.50	Gulshan Polyols Ltd Revenue and Growth Rate
      Fig.51	Gulshan Polyols Ltd Market Share
      Fig.52	ILC Resources Revenue and Growth Rate
      Fig.53	ILC Resources Market Share
      Fig.54	Imerys Revenue and Growth Rate
      Fig.55	Imerys Market Share
      Fig.56	J.M Huber Corp Revenue and Growth Rate
      Fig.57	J.M Huber Corp Market Share
      Fig.58	LafargeHolcium Revenue and Growth Rate
      Fig.59	LafargeHolcium Market Share
      Fig.60	Midwest Calcium Carbonates Revenue and Growth Rate
      Fig.61	Midwest Calcium Carbonates Market Share
      Fig.62	Mineral Technologies Revenue and Growth Rate
      Fig.63	Mineral Technologies Market Share
      Fig.64	NALC LLC Revenue and Growth Rate
      Fig.65	NALC LLC Market Share
      Fig.66	Omya Revenue and Growth Rate
      Fig.67	Omya Market Share
      Fig.68	The National Lime & Stone Company Revenue and Growth Rate
      Fig.69	The National Lime & Stone Company Market Share
      Fig.70	United States Lime & Material Inc Revenue and Growth Rate
      Fig.71	United States Lime & Material Inc Market Share
      Fig.72	Market Dynamics
      Fig.73	Global Calcium Carbonate – Value Chain Analysis
      Fig.74	Key Mandates and Regulations
      Fig.75	Technology Roadmap and Timeline
      Fig.76	Market Attractiveness Analysis – By Application
      Fig.77	Market Attractiveness Analysis – By Region
      Fig.78	Calcium Carbonate Industrial Chain Analysis
      Fig.79	Market Channels
      Fig.80	Marketing Channel Development Trend
      Fig.81	Growth in World Gross Product, 2008-2018
      

      List of Tables

      Table 1	Global Calcium Carbonate Market, 2019 & 2026 (USD Billion)
      Table 2	Global Calcium Carbonate Market, by Application, 2016 – 2026 (USD Billion)
      Table 3	Global Calcium Carbonate Market, by Region, 2016 – 2026 (USD Billion)
      Table 4	North America Calcium Carbonate Market, by Country, 2016 – 2026 (USD Billion)
      Table 5	North America Calcium Carbonate Market, by Application, 2016 – 2026 (USD Billion)
      Table 6	Europe Calcium Carbonate Market, by Country, 2016 – 2026 (USD Billion)
      Table 7	Europe Calcium Carbonate Market, by Application, 2016 – 2026 (USD Billion)
      Table 8	Asia Pacific Calcium Carbonate Market, by Country, 2016 – 2026 (USD Billion)
      Table 9 Asia Pacific Calcium Carbonate Market, by Application, 2016 – 2026 (USD Billion)
      Table 10 Latin America Calcium Carbonate Market, by Country, 2016 – 2026 (USD Billion)
      Table 11 Latin America Calcium Carbonate Market, by Application, 2016 – 2026 (USD Billion)
      Table 12 The Middle-East and Africa Calcium Carbonate Market, by Country, 2016 – 2026 (USD Billion)
      Table 13 The Middle-East and Africa Calcium Carbonate Market, by Application, 2016 – 2026 (USD Billion)
      Table 14 Global Calcium Carbonate Market - Company Revenue Analysis, 2016 – 2019 (USD Billion)
      Table 15 Global Calcium Carbonate Market - Company Revenue Share Analysis, 2016 – 2019 (%)
      Table 16 Acquisitions and Mergers
      Table 17 Market Drivers – Impact Analysis
      Table 18 Market Restraints
      Table 19 Market Opportunities
      Table 20 Major Buyers of Calcium Carbonate
      Table 21 Distributors/Traders of Calcium Carbonate by Region
      

Industry Major Market Players

  • AGSCO Corp
  • Carmeuse
  • Blue Mountain Minerals
  • GCCP Resources
  • GLC Minerals LLC
  • Greer Limestone Company
  • Gulshan Polyols Ltd
  • ILC Resources
  • Imerys
  • J.M Huber Corp
  • LafargeHolcium
  • Midwest Calcium Carbonates
  • Mineral Technologies
  • NALC LLC
  • Omya
  • The National Lime & Stone Company
  • United States Lime & Material Inc.